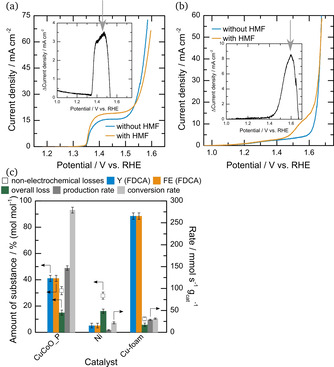
Figure 5.

(a) CVs of Ni on BDD without (blue) and with 5 mM HMF (orange), as well as the difference of both (inset) with later electrolysis potential indicated by a grey arrow. (b) CVs of Cu‐foam without (blue) and with 5 mM HMF (orange), as well as the difference of both (inset) with later electrolysis potential indicated by a grey arrow. (c) Yield and faradaic efficiency towards FDCA (Y (FDCA) and FE (FDCA), respectively) are shown in blue and orange with overall loss (green), non electrochemical loss for comparison (blank squares), as well as production and conversion rate (dark and light grey, respectively) for electrolysis of CuCoO_P (left) and Ni (middle) on BDD and Cu‐foam at 1.52, 1.46 and 1.6 V vs. RHE, respectively, with Pt as cathode in a divided cell.
