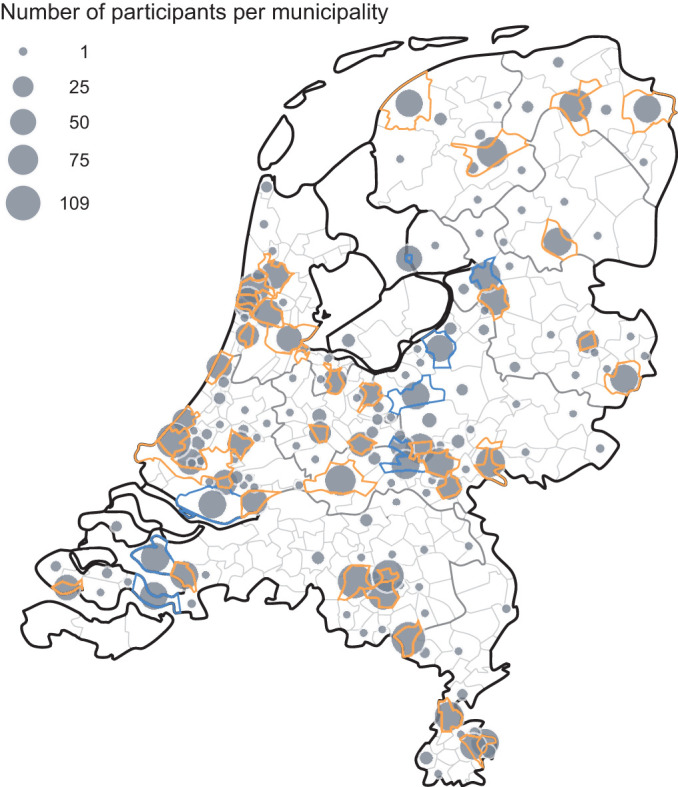
Figure 1.

Geographical representation of number of participants in the PICO-study, the Netherlands, first round of inclusion, per municipality. The size of the dots reflect the absolute number of participants. Thicker grey and smaller light grey boundaries represent provinces and municipalities, respectively, and orange and blue boundaries characterise municipalities from the national and low vaccination coverage sample, respectively.
