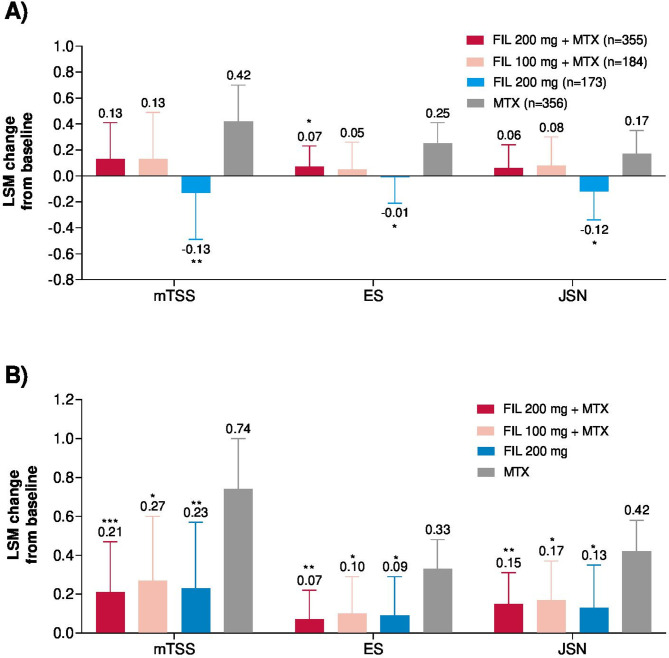
Figure 3.
Change in modified total Sharp/van der Heijde score (mTSS) and components from baseline at (A) week 24 and (B) week 52. ***Exploratory p<0.001; **exploratory p<0.01; *exploratory p<0.05; for supportive analysis without adjustment for multiplicity. Error bars represent 95% CI. For mTSS, week 24 includes only data from campaign A and week 52 includes data from campaign A and B. Week 52 n values are not provided for mTSS change from baseline, as the analysis included both campaign A (through week 24) and campaign B (through week 52 including re-reading of baseline and week 24). ES, erosion score; FIL, filgotinib; JSN, joint space narrowing; LSM, least-squares mean; MTX, methotrexate.

