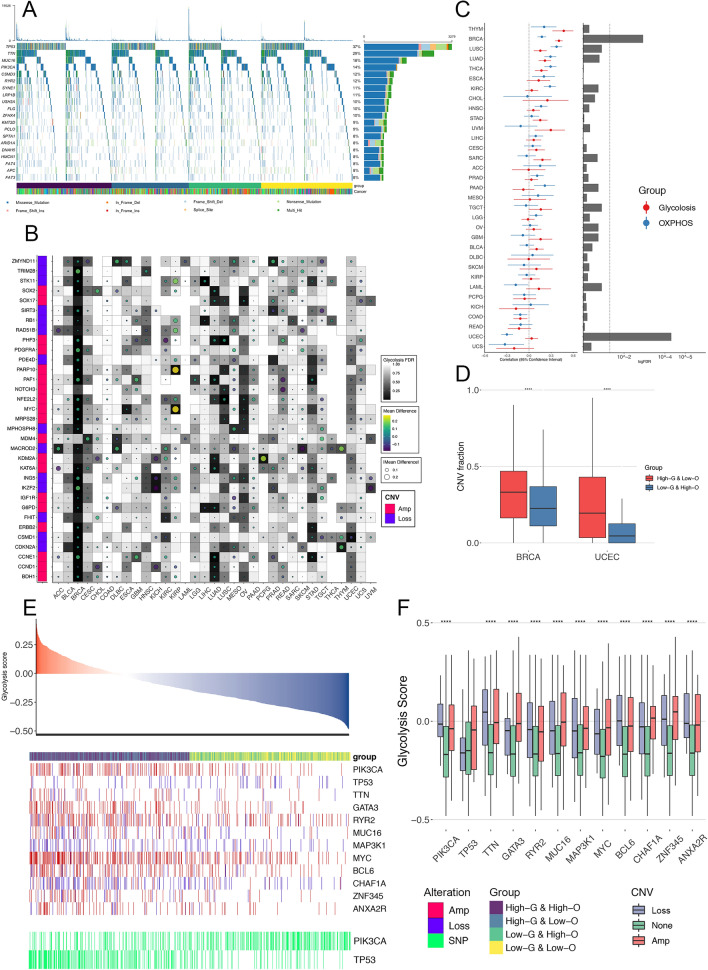
Fig. 5.
A The waterfall plots summarizing the somatic SNVs of 20 most-frequently mutated genes in the four metabolic subgroups across 33 cancer types. The type of alterations was annotated by different colors (bottom). B Association of Glycolysis score with CNVs in oncogenes (labeled as red on the left) and tumor suppressor genes (labeled as blue on the left, Wilcoxon test). Dot size and color indicate the difference in mean Glycolysis between tumors with a CNV (gain for oncogene and loss for tumor suppressor gene) and those without. Background color indicates the FDR of Wilcoxon test. The empty region indicates that in that cancer type, there is no CNV of a specific gene. C Left: The correlation between CNV fraction and two pathway scores. Center dots represent Pearson’s r, and error bars represent the 95% CI. Right: FDR were calculated by Wilcoxon test to compare the CNV fraction between HGLO and LGHO group across multiple cancer types. D Box plots displaying the distribution of CNV fraction between HGLO and LGHO group in BRCA and UCEC. Within each group, the lines in the boxes represent the median value. The bottom and top of the boxes are the 25th and 75th percentiles (interquartile range). The whiskers encompass 1.5 times the interquartile range. The statistical difference of two scores was compared through the Wilcoxon test. ****p < 0.0001. E Associations of SNVs and CNAs with Glycolysis score in BRCA patients. F Box plots displaying the distribution of Glycolysis score among patients with different CNV status (amplification, loss, and none) in BRCA. Within each group, the lines in the boxes represent the median value. The bottom and top of the boxes are the 25th and 75th percentiles (interquartile range). The whiskers encompass 1.5 times the interquartile range. The statistical difference of two scores was compared through the Wilcoxon test. ****p < 0.0001

