
Figure 4. Diverse Transcription Factor and RNA Pol II localization to SG cell nuclei.
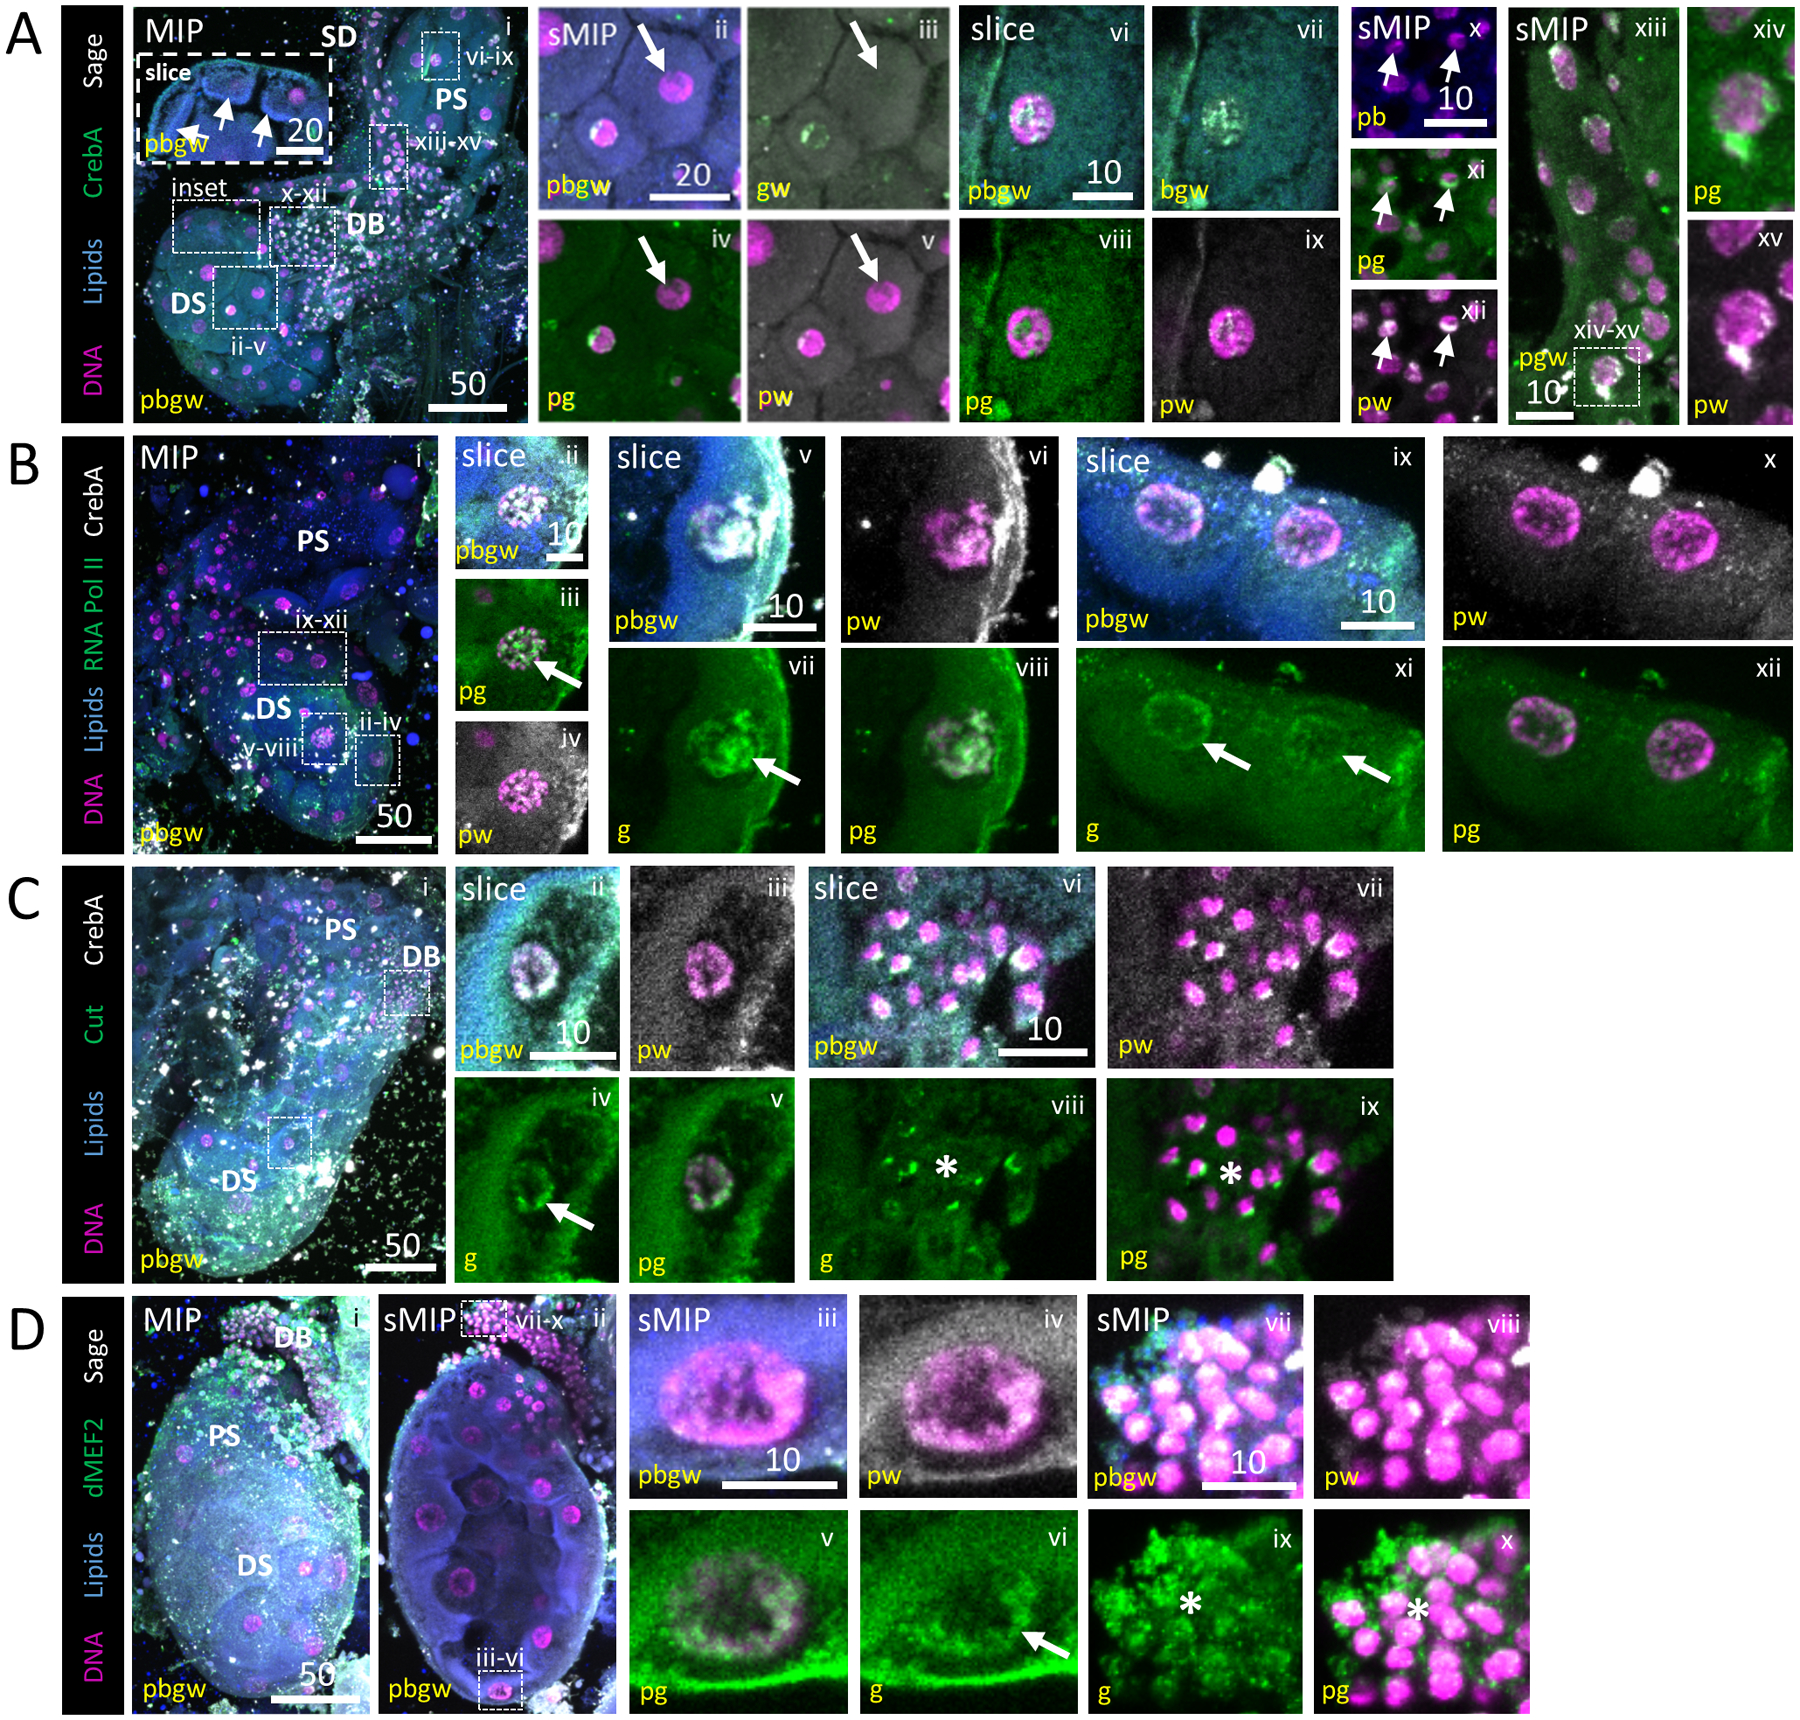
Representative images from dissected L4 larval salivary glands stained with Hoechst (DNA, purple), Nile Red (lipids, blue), antisera against the SG TFs CrebA (A, green; B, C, grey) or Sage (A, D, grey) and antisera against either RNA polymerase II (B, green), the gut TF Cut (C, green) or the muscle TF dMEF2 (D, green). (A) Two SGs (i). Both Sage and CrebA enrichment are observed in nuclei of the distal sac (ii–v), proximal sac (vi–ix), duct bud (arrow, x–xii) and salivary duct (xiii, xv) cells. Some cells have no enrichment (arrow, ii–v). Low level cytoplasmic signal is also observed. (B) RNA Pol II staining was variably enriched [high (arrow), ii–viii; low (arrows), ix–xii] across sac (distal, ii–viii) and duct bud (ix–xii) nuclei. (C) Cut enrichment was observed in sac (arrow, ii–v) and duct bud (asterisk, vi–ix) nuclei. (D) dMEF2 was also enriched on the DNA of sac (arrow, iii–vi) and duct bud (asterisk, vii–x) nuclei.