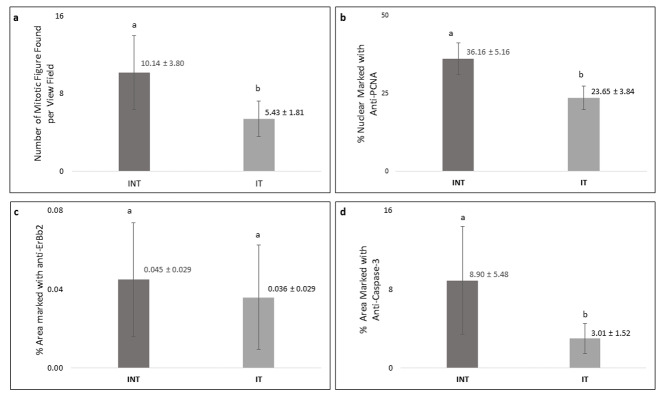
Figure 6. Number of mitotic figures and percentage of PCNA, ErbB2, and caspase-3-positive cells in mammary tumors.
( a) number of mitotic figures, ( b) percentage of PCNA-positive cells, ( c) percentage of ErbB2-positive cells, ( d) percentage of caspase-3-positive cells. Error bars represent the standard error of the mean. Different letters ( a, b) on top of the charts indicate significant differences (p<0.05).

