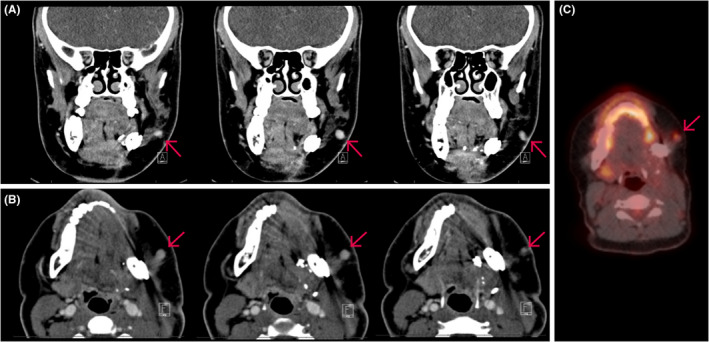
FIGURE 2.

Three months postoperative PET/CT scan (Philips Medical; Cambridge, MA, USA). Representative image series of coronal (A) and axial (B) CT maxillofacial with contrast following left mandibulectomy and fibular graft reconstruction. Red arrow indicating tubular soft tissue lesion in the region of the previous needle biopsy tract. (C) Positron emission tomographic showed corresponding hypermetabolic soft tissue focus within the subcutaneous tissues of the left cheek
