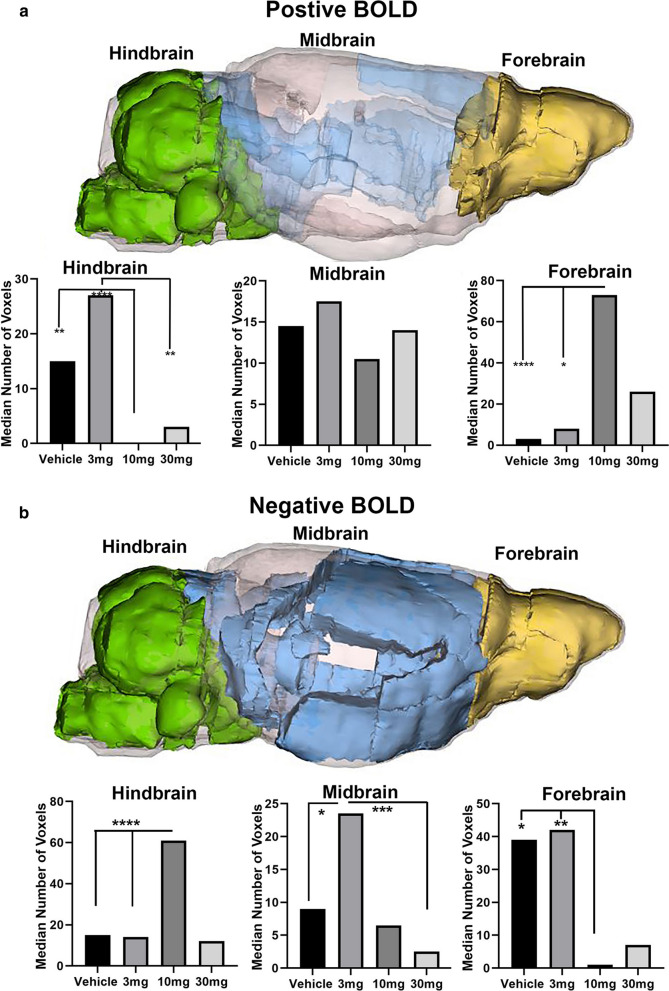
Fig. 1.
Polarized Positive and Negative BOLD. The color-coded 3D reconstructions for positive and negative BOLD denote the location of the brain areas comprising the hindbrain, midbrain, and forebrain, respectively. The bar graphs below show the average median number of voxels from each of these brain regions for vehicle, 3, 10, and 30 mg/kg I.P. doses of CBD. For forebrain positive BOLD: (****p < 0.0001, 10 mg > Veh); (*p = 0.0133, 10 mg > 3 mg). For hindbrain positive BOLD: (**p = 0.0012, 10 mg < Veh); (****p < 0.00001, 10 mg < 3 mg); (**p = 0.0019, 10 mg < 3 mg). For forebrain negative BOLD: (*p = 0.0197, 10 mg < Veh); (**p = 0.0043 10 < 3 mg). For midbrain negative BOLD: (*p = 0.0389; 3 mg > Veh); (***p = 0.0006, 3 mg > 30 mg). For hindbrain negative BOLD:D voxels (median ca 16) that is significantly increased with the 10 mg dose of CBD over vehicle and 3 mg (****p ≤ 0.0001, 10 mg > Veh, 10 mg > 3 mg)

