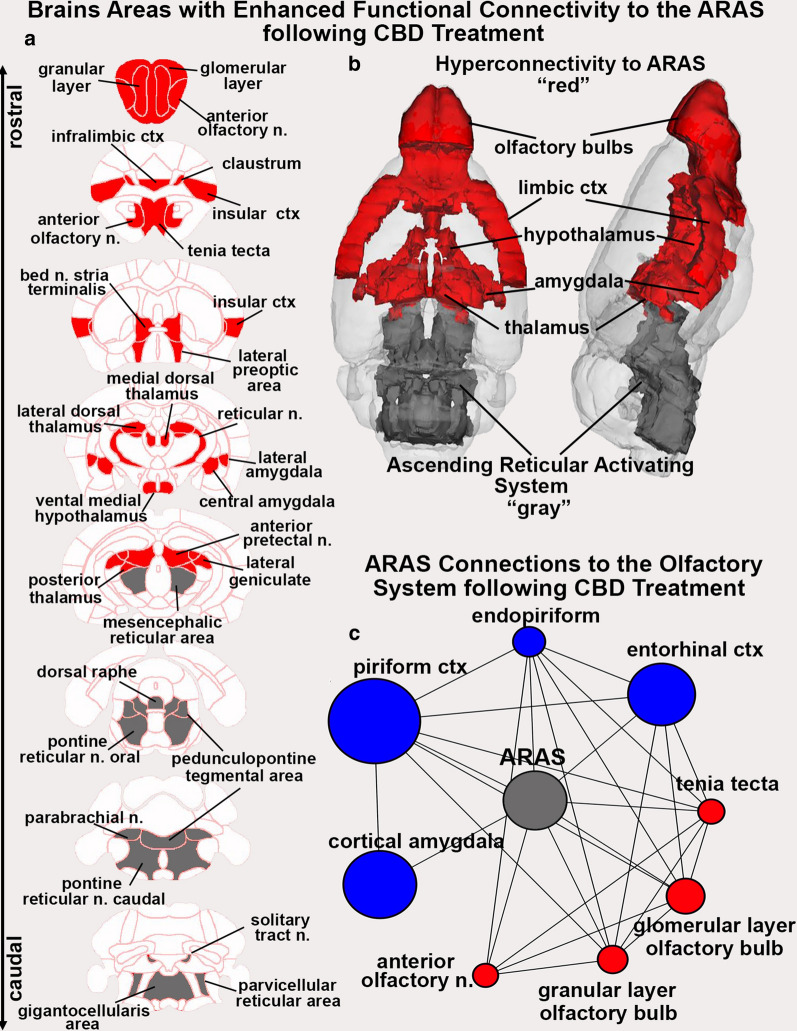
Fig. 4.
Hyperconnectivity to the ARAS with CBD Treatment. Shown to the left (a) are 2D axial maps showing the location of brain areas (red) with enhanced coupling to the ARAS following CBD treatment. Areas in gray denote the location of brain areas comprising the ARAS. The 2D images are summarized in the 3D reconstruction of the red and gray brain areas (b). The circle of connections beneath (c), display the neighboring nodes of the ARAS in the CBD treated group within the olfactory system. Nodes that have a greater degree centrality in the CBD group have been colored red, while nodes that have a greater degree centrality in the vehicle group have been colored blue. Node size has been scaled to reflect the relative difference in degree centrality between the vehicle and CBD group, with the larger nodes reflecting a larger difference in degree centrality

