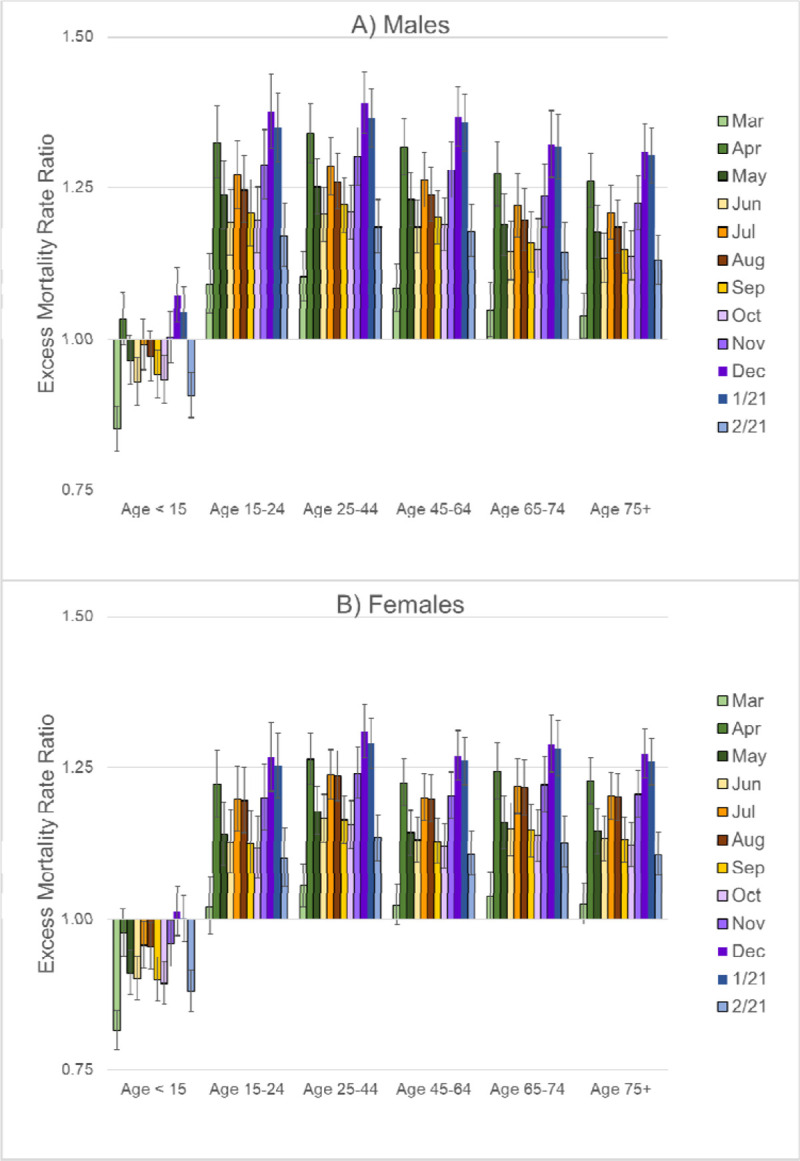
Figure 1. Excess Mortality Rate Ratios from All-Cause Mortality (Including COVID-19) by Age Group During March-December 2020, US: A) Males, B) Females.

Note: These estimates are based on the regression models shown in eTable 1. A rate ratio higher than 1.0 implies that the mortality rates were higher than expected based on the pre-pandemic trends, whereas a value less than 1.0 suggest lower than expected mortality rates. The bars on the graph of excess mortality rate ratios represent the 95% confidence interval.
