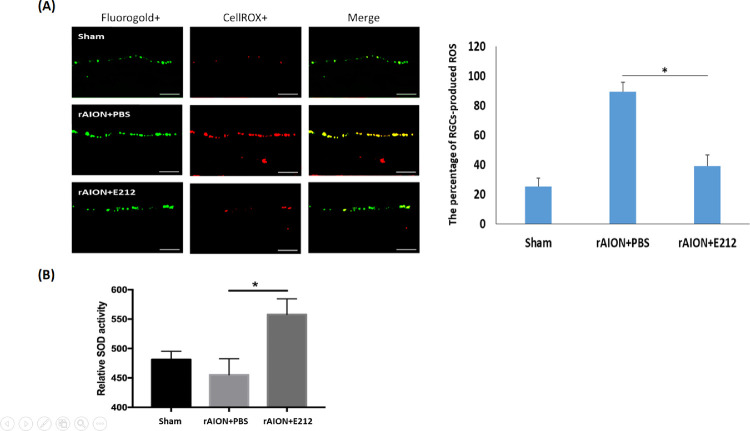
Figure 2.
Oxidative stress levels in retinal tissues at day 1 after rAION. (A) Representative fluorescence images of frozen sections showing ROS-producing cells (shown in red) and FG-positive cells (shown in green) in the GCL. Scale bar: 50 µm. (B) The relative SOD activity in the retinal tissues at day 1 after infarct. The relative SOD activity in the E212-treated group was 1.23-fold higher than that in the PBS-treated group (P < 0.01). Data are expressed as the mean ± SD. FG, FluoroGold; GCL, ganglion cell layer.

