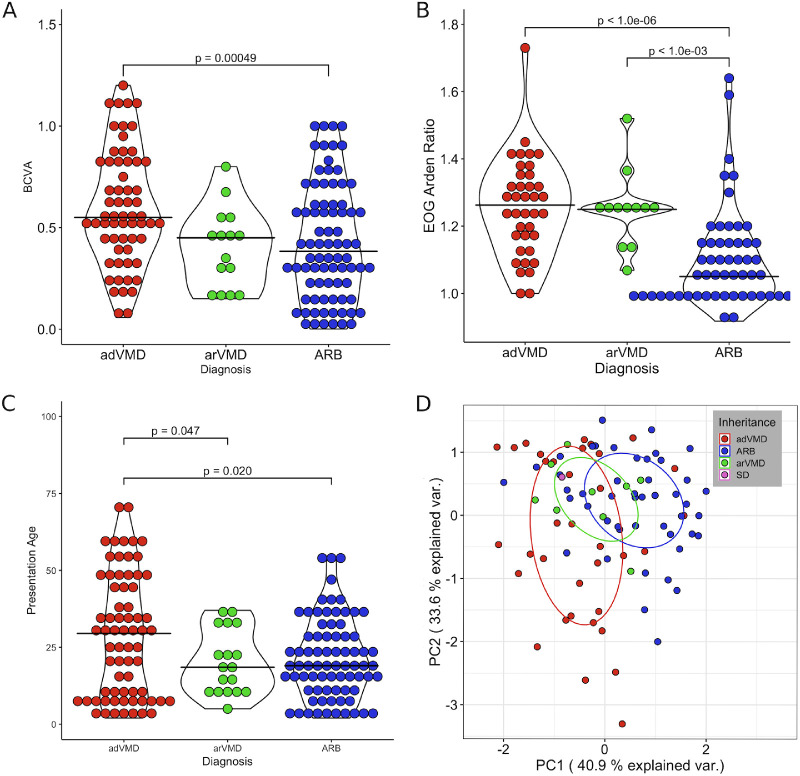
Figure 4.
Histograms with overlaid violin plots describing the distribution of (A) BCVA, (B) EOG Arden ratio, and (C) presentation age for VMD and ARB patients. Black cross bars indicate means. (D) PCA of ARB and VMD patients. PC1 is primarily composed of VA and EOG while PC2 is primarily composed of age.

