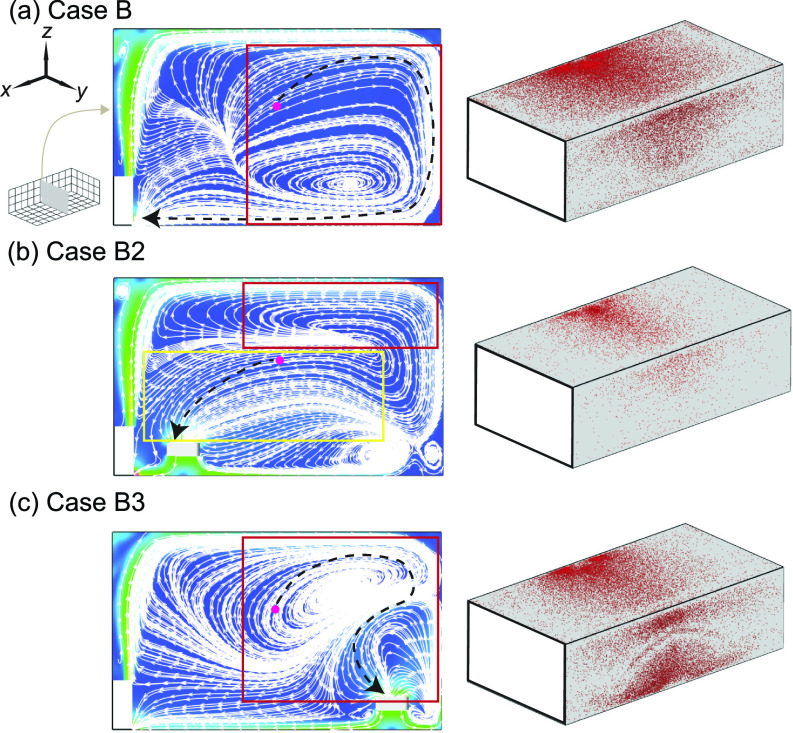
FIG. 7.
Streamline flow map at the middle y-z plane (left) and aerosol wall deposition on the ceiling and right-side walls (right) for (a) case B, (b) case B2, and (c) case B3. The inset figure in (a) illustrating the positions of planes shown in the figures. The magenta dot represents the inject location and the black dashed lines in the streamline maps are used to illustrate potential pathways of the aerosols being extracted by the HUV or air cleaner.

