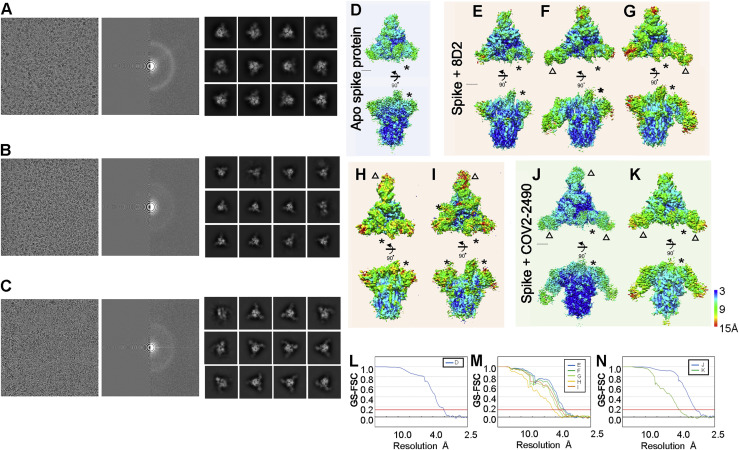
Figure S4.
Cryo-EM density map of spike of SARS-CoV-2 with antibody, related to Figure 5
(A-C) A representative micrographs (left), CTF estimation of a micrograph on left panel (middle), and typical 2D class averages. (A) Apo spike protein of SARS-CoV-2. (B) Spike protein with 8D2 antibody. (C) Spike protein with COV2-2490 antibody. The final density map from single particle cryo-EM is colored by local resolution (A-H). (D) Apo spike protein (EMDBID: 30915). (E-I) Spike protein with 8D2 antibody (EMDBID: 30916, 30917, 30918, 30919, and 30920). (J-K) Spike protein with 2490 antibody (EMDBID: 30921 and 30922). Asterisks indicate the rise form of RBD domains. Triangles indicate the binding positions of antibody. (L-N) The GS-FSC curves for each corresponding map are shown. Red line indicates FSC = 0.143 criteria. Scale bars are 30 Å.

