
Figure 2. Long-term co-culture of pks+ E. coli induces SBS-pks and ID-pks mutational signatures.
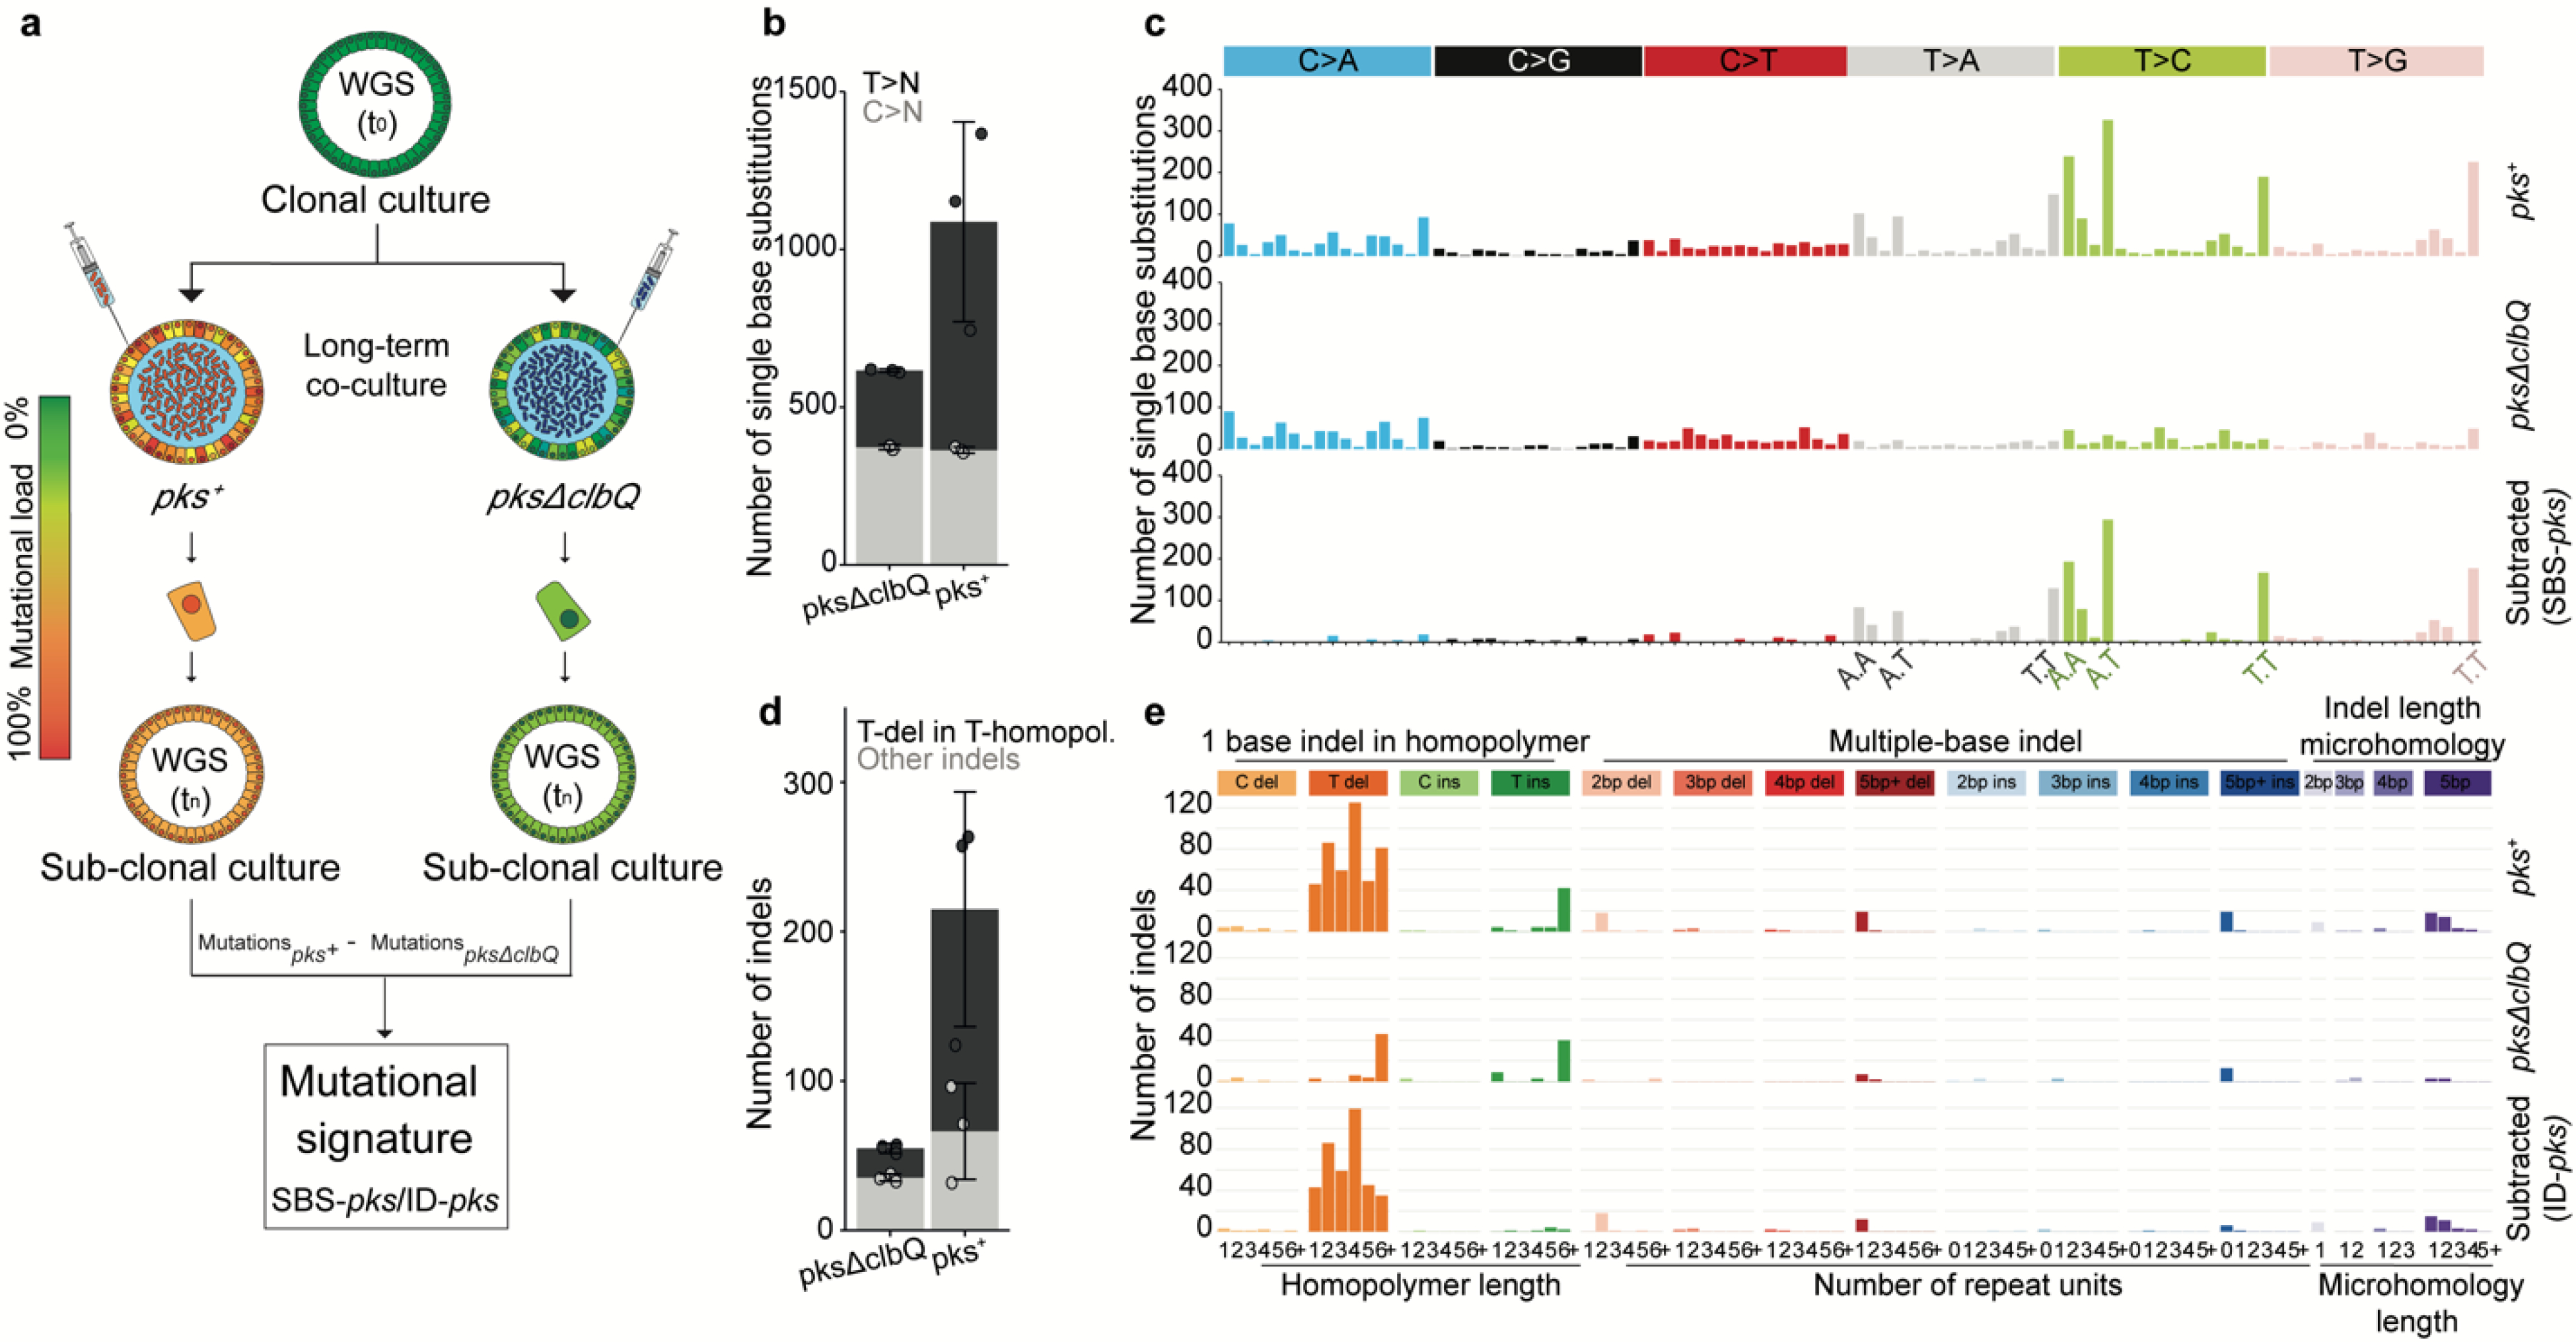
a, Schematic representation of the experimental setup. b, The number of single base substitutions (SBS) that accumulated in organoids co-cultured with either pks+ or pksΔclbQ E. coli (n = 3 clones). Box height indicates mean number of events, error bars represent SD. c, SBS 96-trinucleotide mutational spectra in organoids exposed to either pks+ (top) or pksΔclbQ (middle) E. coli. The bottom panel depicts the SBS-pks signature, which was defined by subtracting pksΔclbQ from pks+ SBS mutations. d, The number of small insertions and deletions (indels) that accumulated in organoids co-cultured either with pks+ or pksΔclbQ E. coli (n = 3 clones). Box height indicates mean number of events, error bars represent SD. e, Indel mutational spectra observed in organoids exposed to either pks+ (top) or pksΔclbQ (middle) E. coli. The bottom panel depicts the ID-pks signature, which was defined by subtracting pksΔclbQ from pks+ indel mutations.