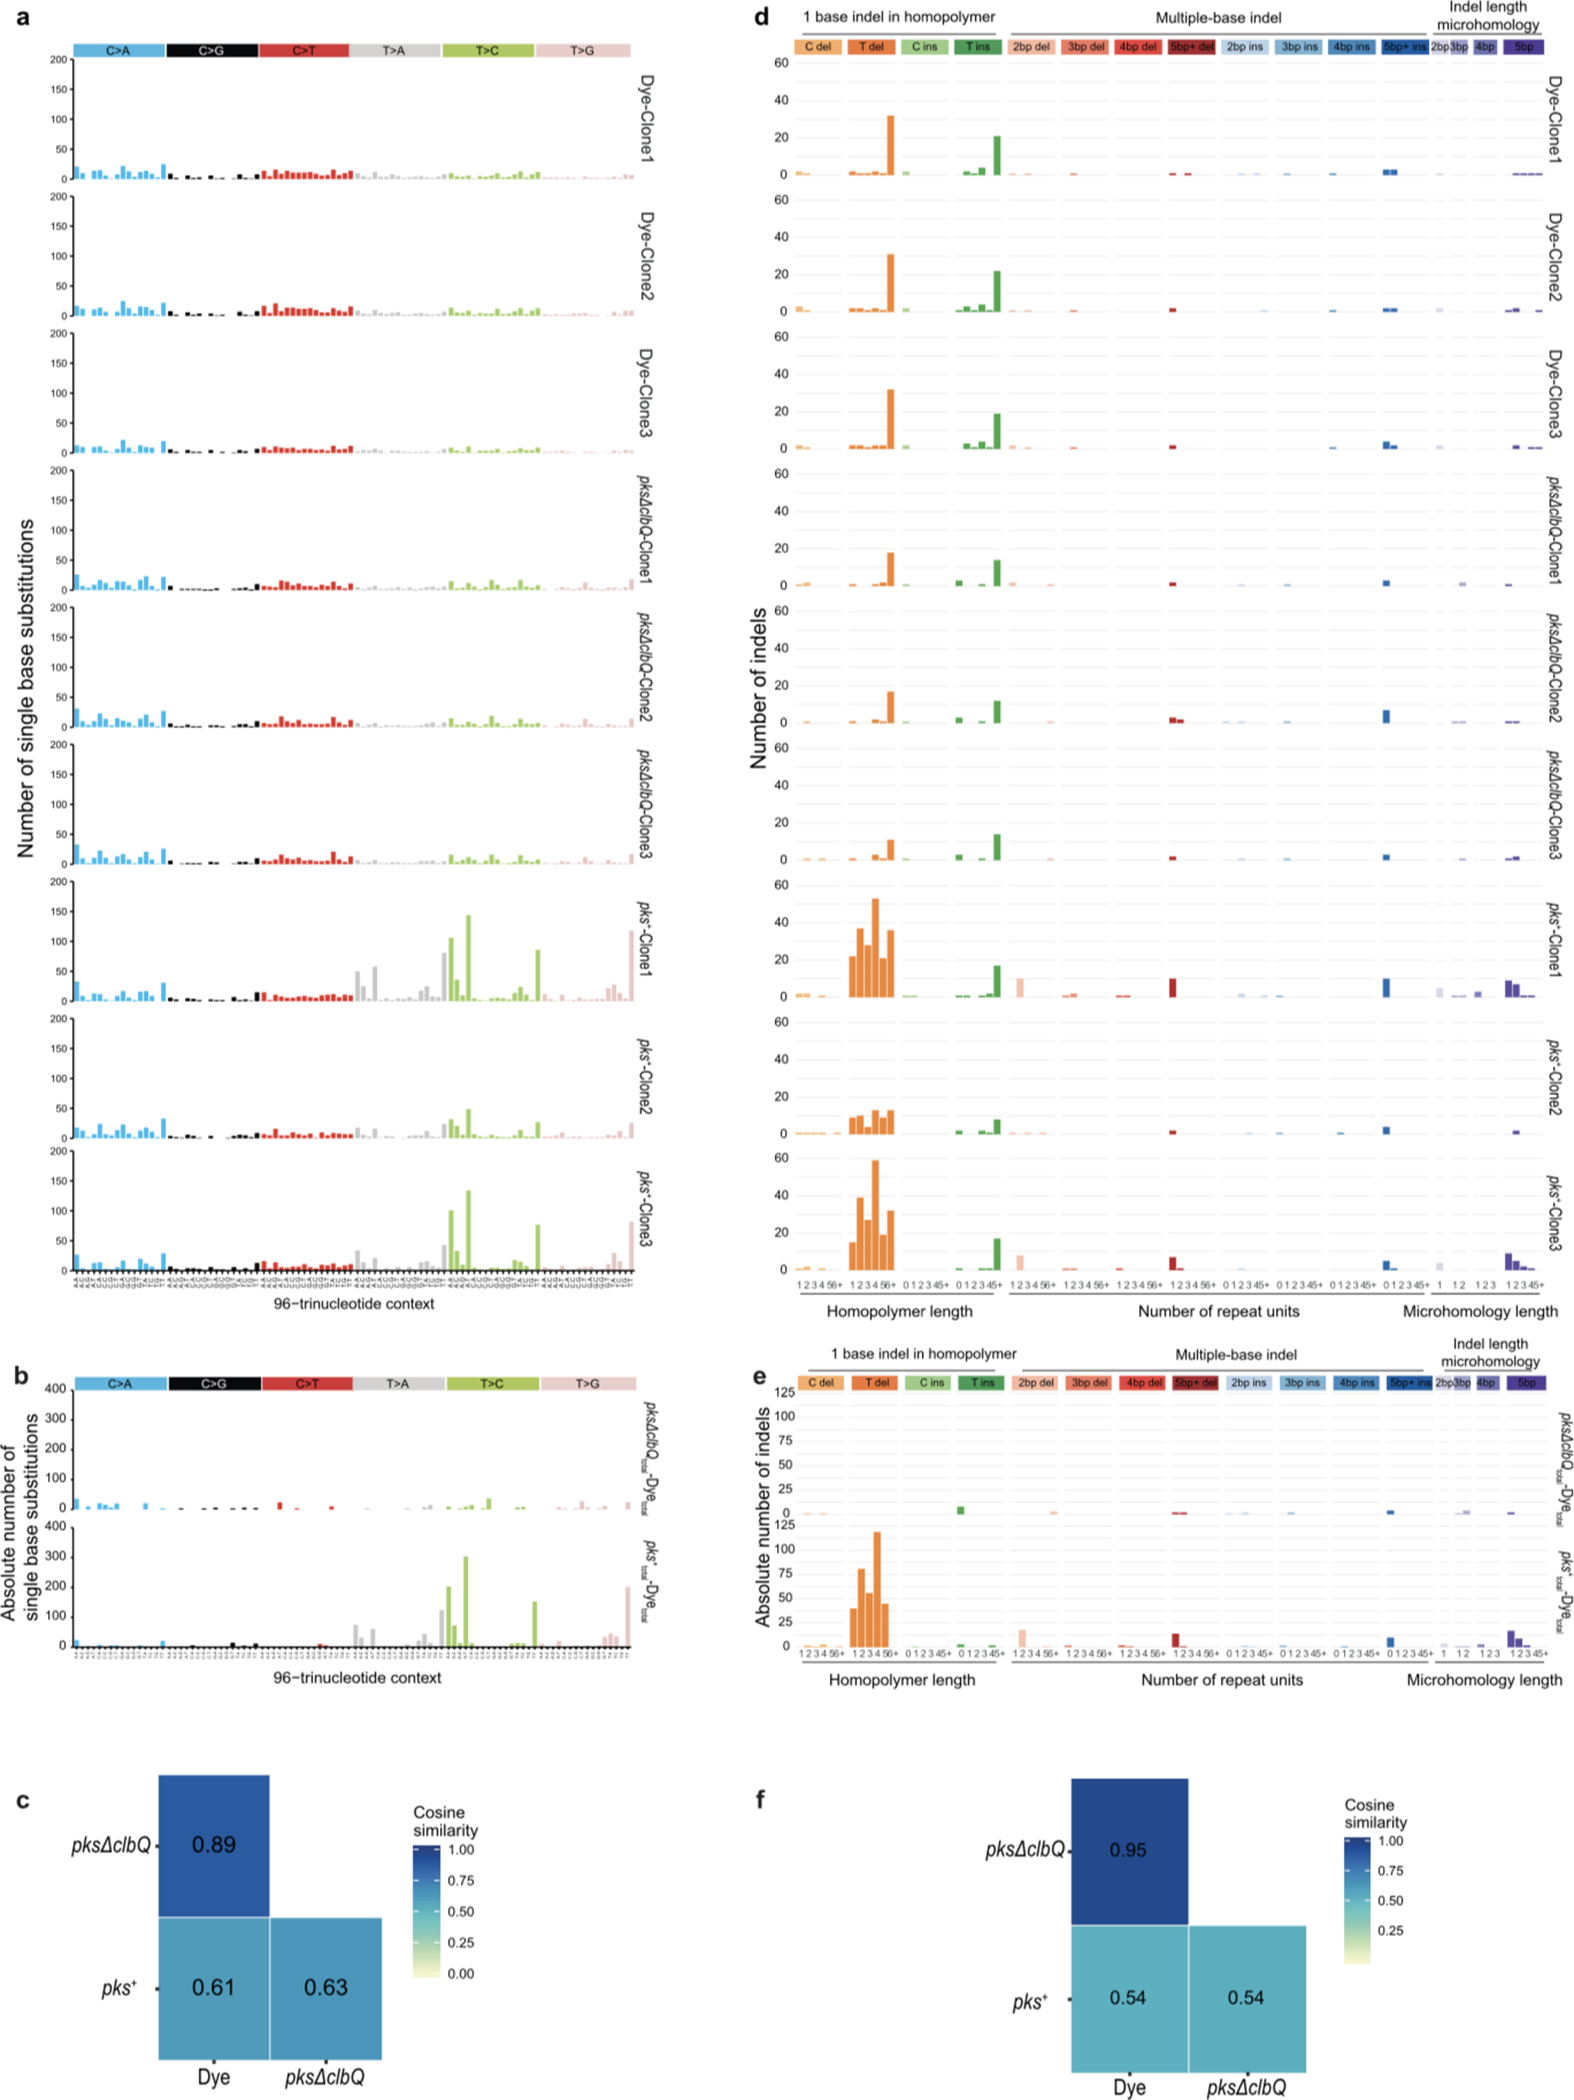
Extended Data Fig. 2. Genotoxic pks+ E. coli induce SBS-pks and ID-pks mutational signatures after long-term co-culture with wild-type intestinal organoids.

a, 96-trinucleotide mutational spectra of SBS in each of the 3 individual clones sequenced per condition. Top 3: dye; middle 3: pksΔclbQ E. coli; bottom 3: pks+ E. coli. b, Total 96-trinucleotide mutational spectra of pks+ and pksΔclbQ from which dye single base substitutions are subtracted. c, Heatmap depicting cosine similarity between dye, pks+ E. coli and pksΔclbQ E. coli 96-trinucleotide mutational profiles. d, Indel mutational spectra plots from each of the 3 individual clones sequenced per condition. Top 3: dye; middle 3: pksΔclbQ E. coli bottom 3: pks+ E. coli e, Total indel mutational spectra of values of pks+ E. coli and pksΔclbQ E. coli from which dye indels are subtracted. f, Heatmap depicting cosine similarity between dye, pks+ E. coli and pksΔclbQ E. coli indel mutational profiles.
