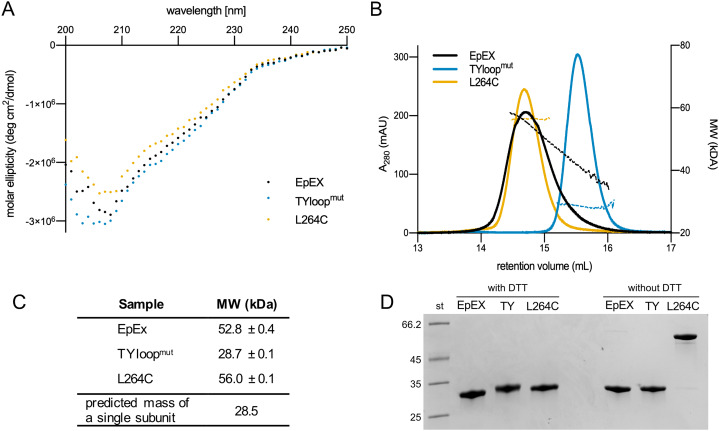
Figure 2. Quality control and oligomeric state analyses of purified EpEX, TYloopmut and L264C.
(A) Overlay of CD spectra. (B) An overlay of representative SEC elution spectra of purified proteins with the corresponding MW fits. (C) The summary of molecular weights, determined with SEC-RALS/LALS. For each sample, mean values and s.d. from two injections are presented. The predicted mass of a single subunit was calculated from EpEX amino-acid sequence with the ProtParam tool (Gasteiger et al., 2005). (D) SDS-PAGE analysis under reducing (with DTT) and non-reducing (w/o DTT) conditions.

