. 2021 Jan 6;2(2):523–536. doi: 10.1039/d0cb00192a

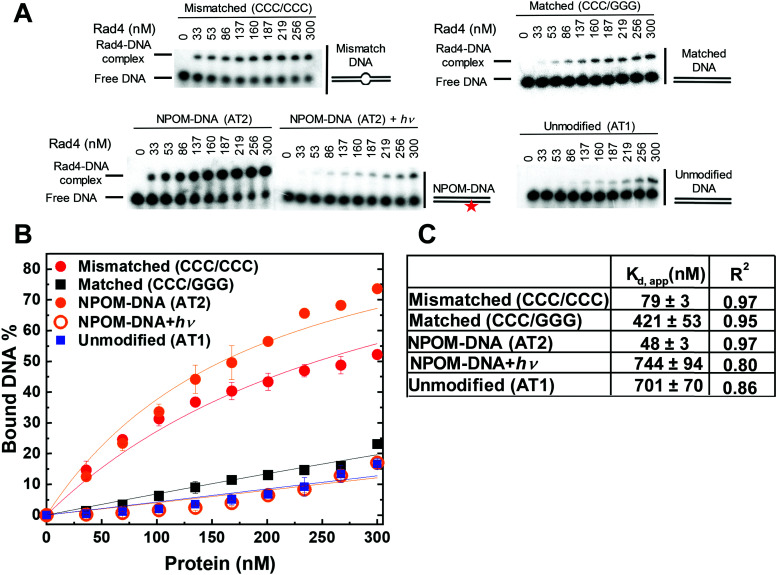
Fig. 3. Apparent Rad4-binding affinities of DNA constructs measured by competition electrophoretic mobility shift assays (EMSA). (A) Typical gel images showing the wild-type Rad4–Rad23 complex binding to various DNA constructs. ‘NPOM-DNA + ’ indicates NPOM-DNA photocleaved by λ = 365 nm light applied for 3 min. Mismatched (CCC/CCC) and matched (CCC/GGG) DNA represent typical specific and nonspecific binding substrates, respectively. The sequences of DNA are in Table S1 (ESI). (B) Quantification of the Rad4-bound DNA fractions versus total concentrations of the protein from gels including those shown in (B). The symbols and error bars indicate the means and ranges as calculated by ± sample standard deviations, respectively, from triplicate experiments. Solid lines indicate the fit curves of the data point. (C) Kd,app and R2 of the fits derived from (B). The errors indicate the errors of the nonlinear regression fit.

Fig. 3