. 2021 Jan 6;2(2):523–536. doi: 10.1039/d0cb00192a

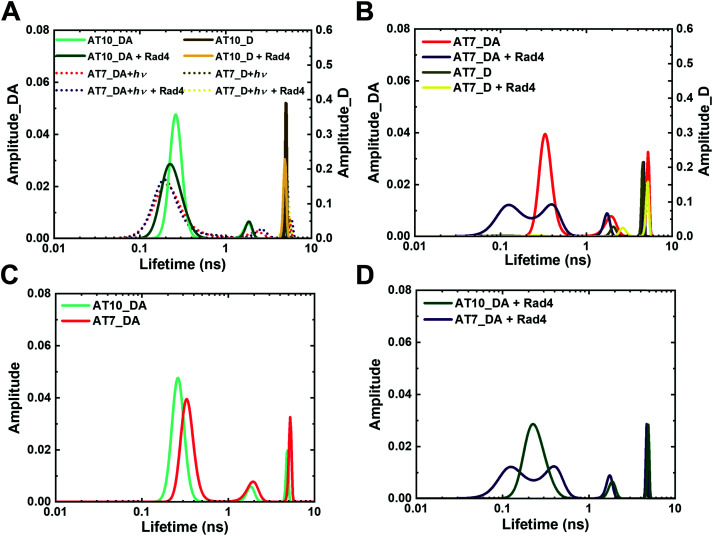
Fig. 4. Fluorescence lifetime distributions obtained from MEM analyses for various tC°–tCnitro-labeled DNA and DNA–protein complexes. “_D” indicate DNA with donor only; “_DA” indicate DNA with donor/acceptor pair. (A) Unmodified DNA (AT10) in the absence and presence of Rad4 and its comparison with NPOM-DNA after 120 s of photocleavage reaction (AT7 + ). (B) NPOM-modified DNA (AT7) in the absence and presence of Rad4. (C and D) Overlay of unmodified (AT10_DA) and NPOM-DNA (AT7_DA) without Rad4 (C) and in the presence of Rad4 (D) Reproducibility of MEM FLT distributions for each DA sample is shown in Fig. S8 (ESI). Full reports of the lifetimes, fractional amplitudes, FRET efficiencies of each peak as well as the sample's average FRET efficiencies are in Table S2 (ESI).

Fig. 4