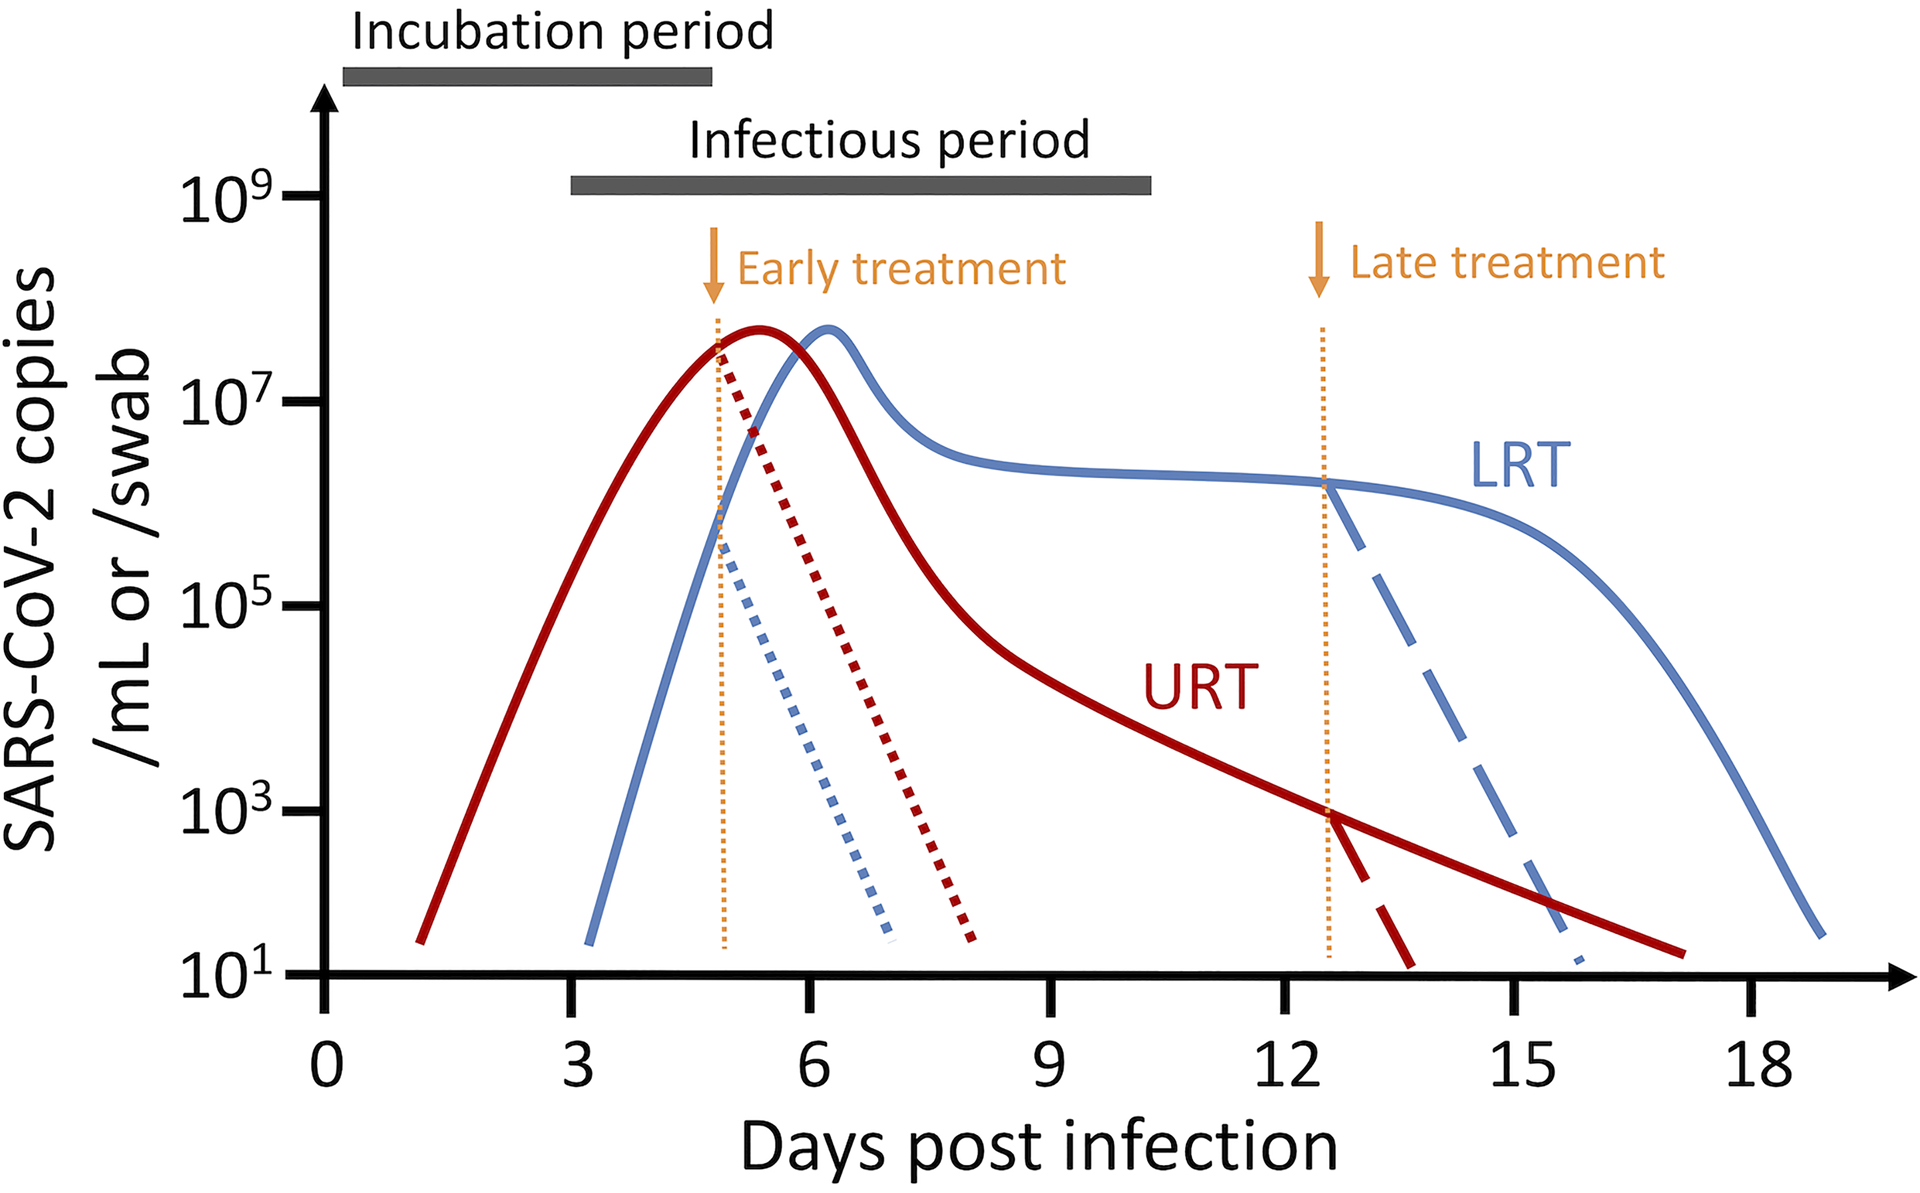
Fig. 4. Illustration of the dynamics of SARS-CoV-2 infection in the upper respiratory tract (URT; solid red line) and the lower respiratory tract (LRT; solid blue line).

The incubation period lasts for approximately 4–6 days (5 day is shown in the figure). The virus population reaches peak viral load at or a couple of days post symptom onset. Individuals become infectious at or a few days before symptom onset. The viral load declines rapidly after peak viremia in the URT, whereas the viral load in the LRT is maintained at intermediate-to-high levels for several weeks. Dotted and dashed lines denote predicted viral load dynamics when individuals are treated with an effective antiviral (e.g. with 95% efficacy) at symptom onset (dotted lines), or 8 days post symptom onset (dashed lines). Viral load curves are drawn based on the data in Refs.57, 82 and parameter estimates in Ref.49.
