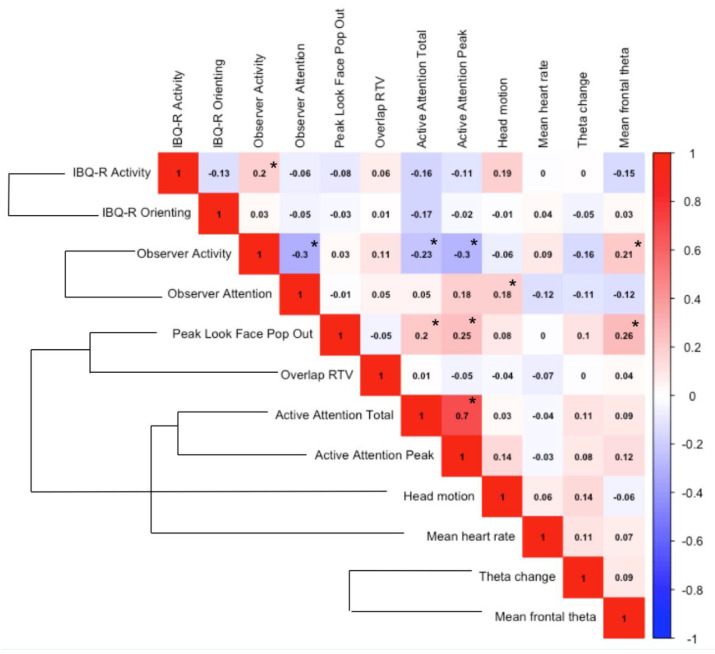
Figure 2.
Correlation matrix heatmap of measures of infant attention and activity level for the full sample at 10 months. External brackets indicate that the two measures come from the same testing domain (e.g., the same EEG or eye-tracking testing session). Spearman r values are shown. Significant correlations (* p < 0.05) are denoted by an asterisk. Given the exploratory nature of this analysis, p-values were not corrected for multiple testing.

