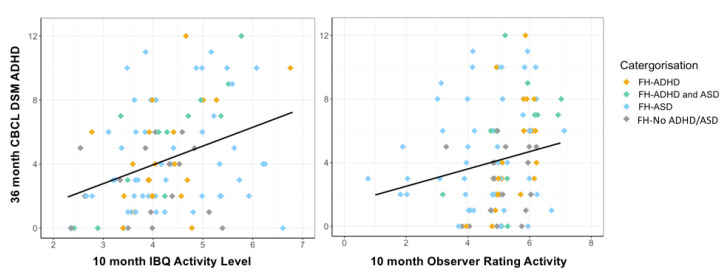
Figure 3.
Infant activity level and 3-year preschool ADHD traits. Scatterplot for the full cohort with regression line showing 10-month activity level (left: IBQ-R Activity Level subscale, and right: observer ratings of activity level) on the x-axis, and the DSM-oriented ADHD subscale of the Child Behaviour Checklist (CBCL) at age 3 years on the y-axis, colour coded by family history group, with jitter due to discrete scales.

