Figure 11.
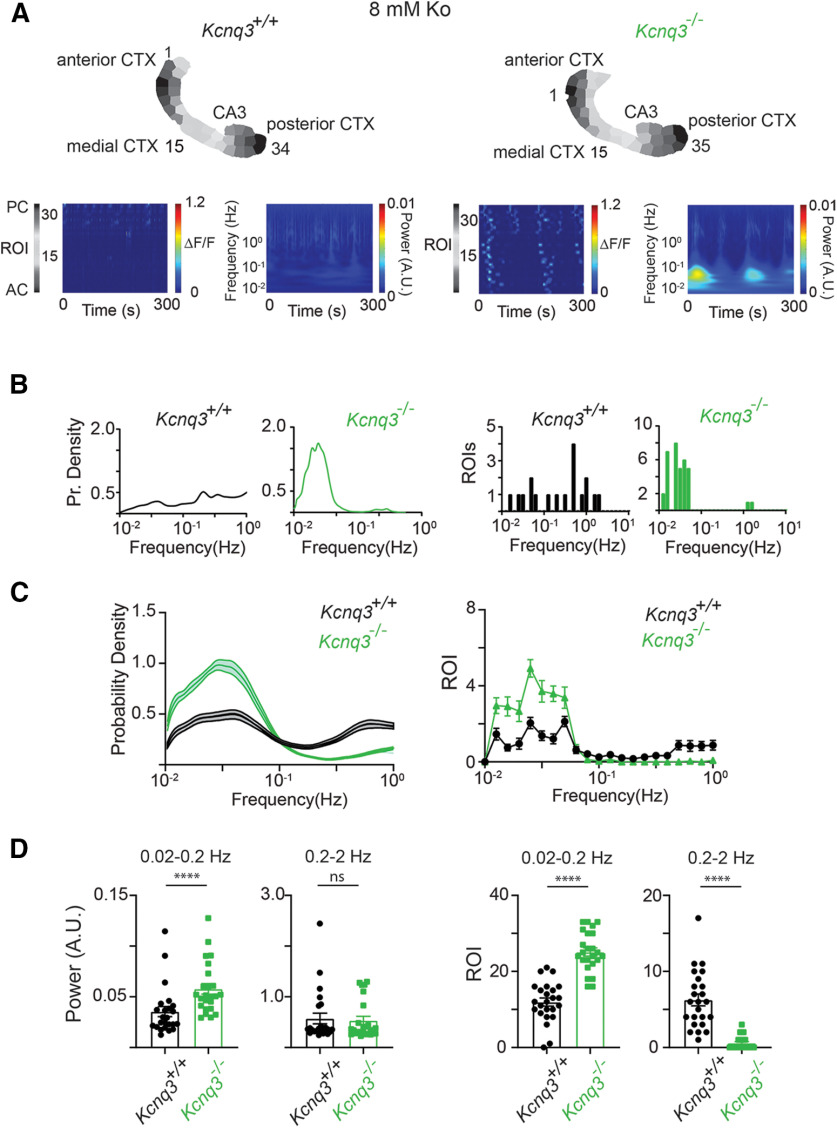
Loss of Kcnq3 leads to LF calcium oscillations in multiple ROIs. All recordings were in the presence of 8 mm Ko. A, Representative examples of Kcnq3+/+and Kcnq3−/− ΔF/F 2D plots and wavelets. Top panels, ROIs used to generate the ΔF/F 2D plots and the wavelets. B, Comparison of the probability density of the frequency of transient oscillations and number of ROIs undergoing sustained oscillations for the examples shown in panel A. C, left, Comparison of the probability density of the frequency of transient oscillations for Kcnq3+/+(n = 24) and Kcnq3−/− (n = 24) across multiple hemispheres. Right, Comparison of ROIs undergoing sustained oscillations for Kcnq3+/+(n = 24) and Kcnq3−/− (n = 24) hemispheres at different frequencies. D, left panels, Summary graphs of the power at two frequency domains, 0.02–0.2 and 0.2–2 Hz. Right panels, Summary graphs of the ROIs exhibiting sustained oscillations at frequency in the range of 0.02–0.2 and 0.2–2 Hz. Data are represented as mean ± SEM (****p < 0.0001). Additional details on the statistical analysis for panel D are found in Table 1 under the Figure 11 section.

