Figure 1.
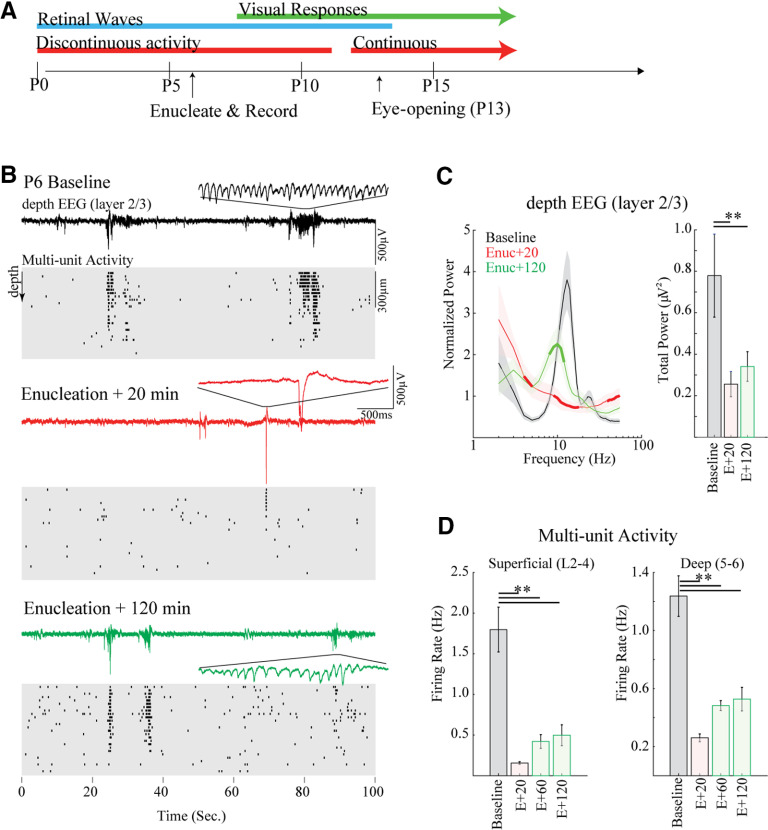
Enucleation acutely reduces activity and spindle-bursts in mouse visual cortex. A, Overview of major developmental stages in visual cortex of the mouse relative to acute enucleation on the sixth postnatal day (P6). B, Representative example of spontaneous activity before (baseline), 20 and 120 min following bilateral enucleation. Top line shows depth EEG, with detail of one spindle-burst. Cleaned multiunit raster of spike times is below. Each line is from a single contact with 25 μm between contacts. Note rapid loss of rapid oscillations in bursts as well as spontaneous spiking at Enuc + 20 min, with some recovery of both by Enuc + 120 min. C, Population mean (n = 5) spectral analysis for dEEG. Left, Mean ± SD spectral power distribution. Thick line segment shows regions of significant difference from preceding condition (i.e., baseline for Enuc + 20, and Enuc + 20 for Enuc + 120) determined by permutation analysis. Right, Summed 1- to 60-Hz power. Animals lose and then recover spindle-burst frequencies following enucleation, but total power remains low. D, Population mean of multiunit firing rates; **p < 0.01 by Tukey’s post hoc test.

