
Figure 4.
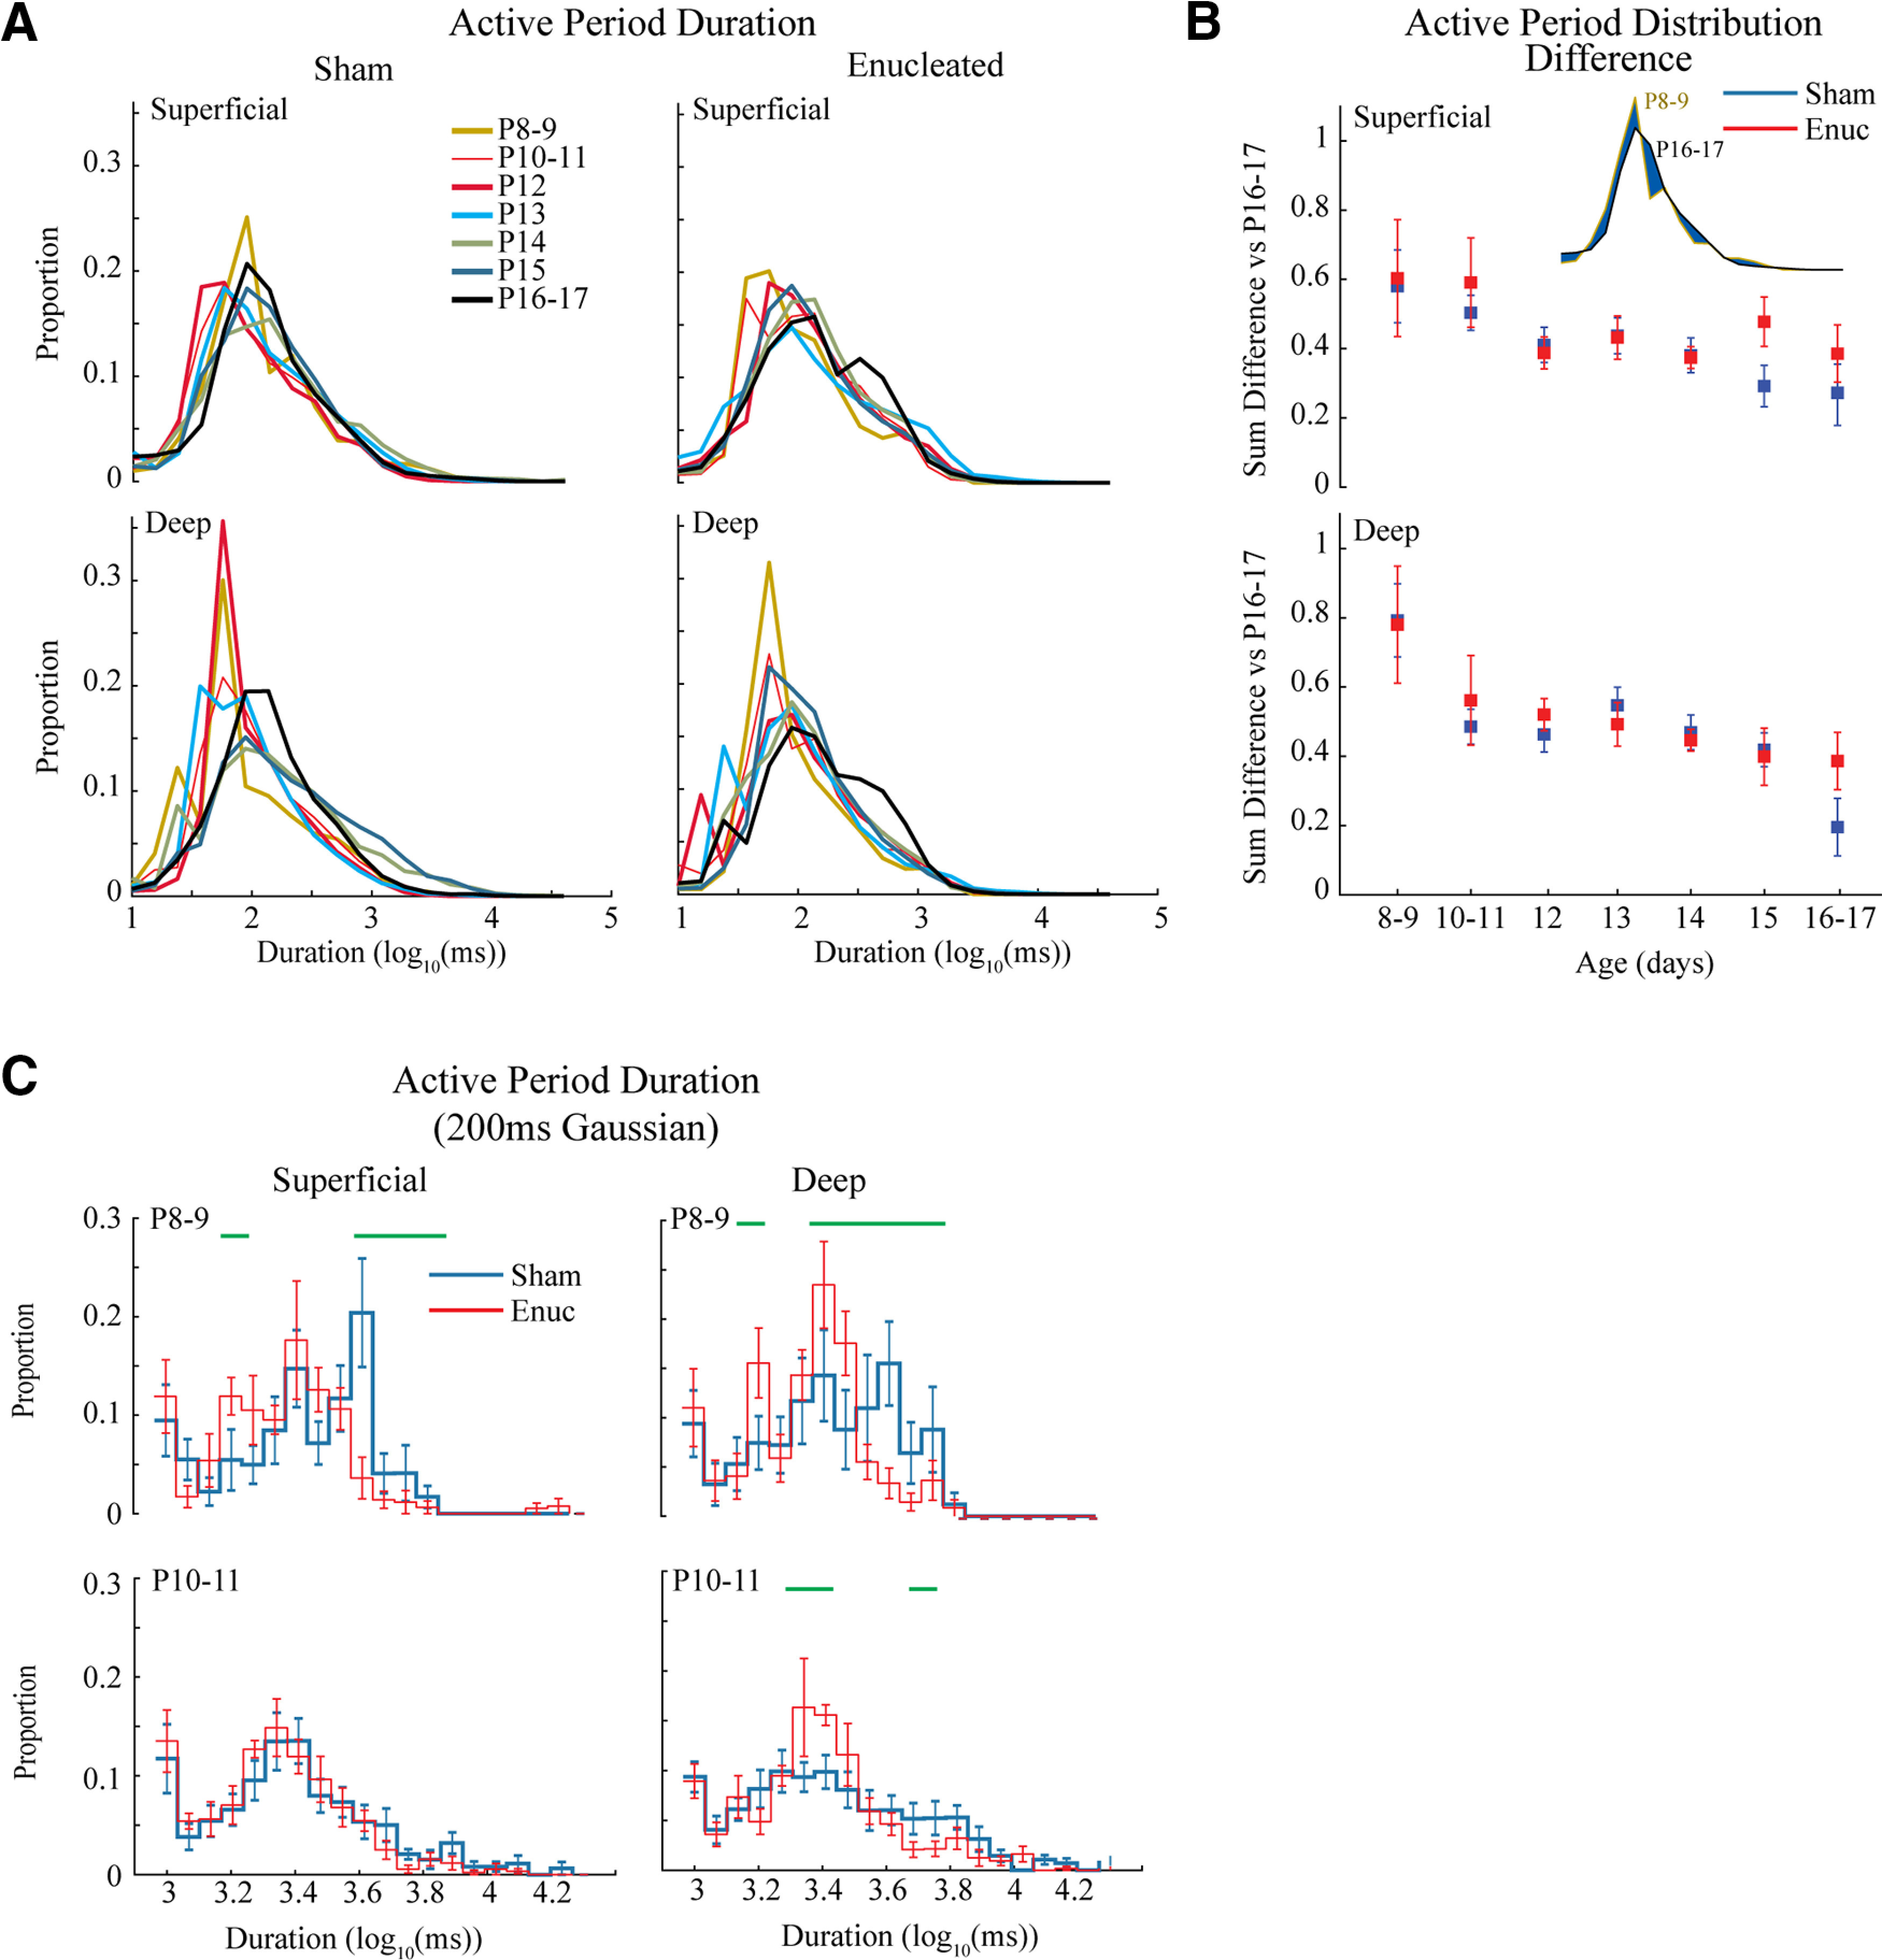
Development of active periods. A, Mean distribution of active period duration by age group. Active period duration is largely similar between ages and treatment groups. B, Quantification of active period duration development. Absolute distance between distributions (shown in inset as blue area) is calculated for all animals in the target age compared with the oldest (P16–P17) group. The mean and 95% confidence intervals (C.I.) for these distances is plotted by age. Results show a steady increase in similarity to P16–P17 for both treatment groups. While an overall effect of group is identified by mANOVA (Table 1), no individual age groups were significantly different between treatments. C, Population mean of active period duration distributions using a longer smoothing filter to eliminate short silent periods. Green lines indicated durations with a significant difference in proportion as determined by permutation analysis (p < 0.05).