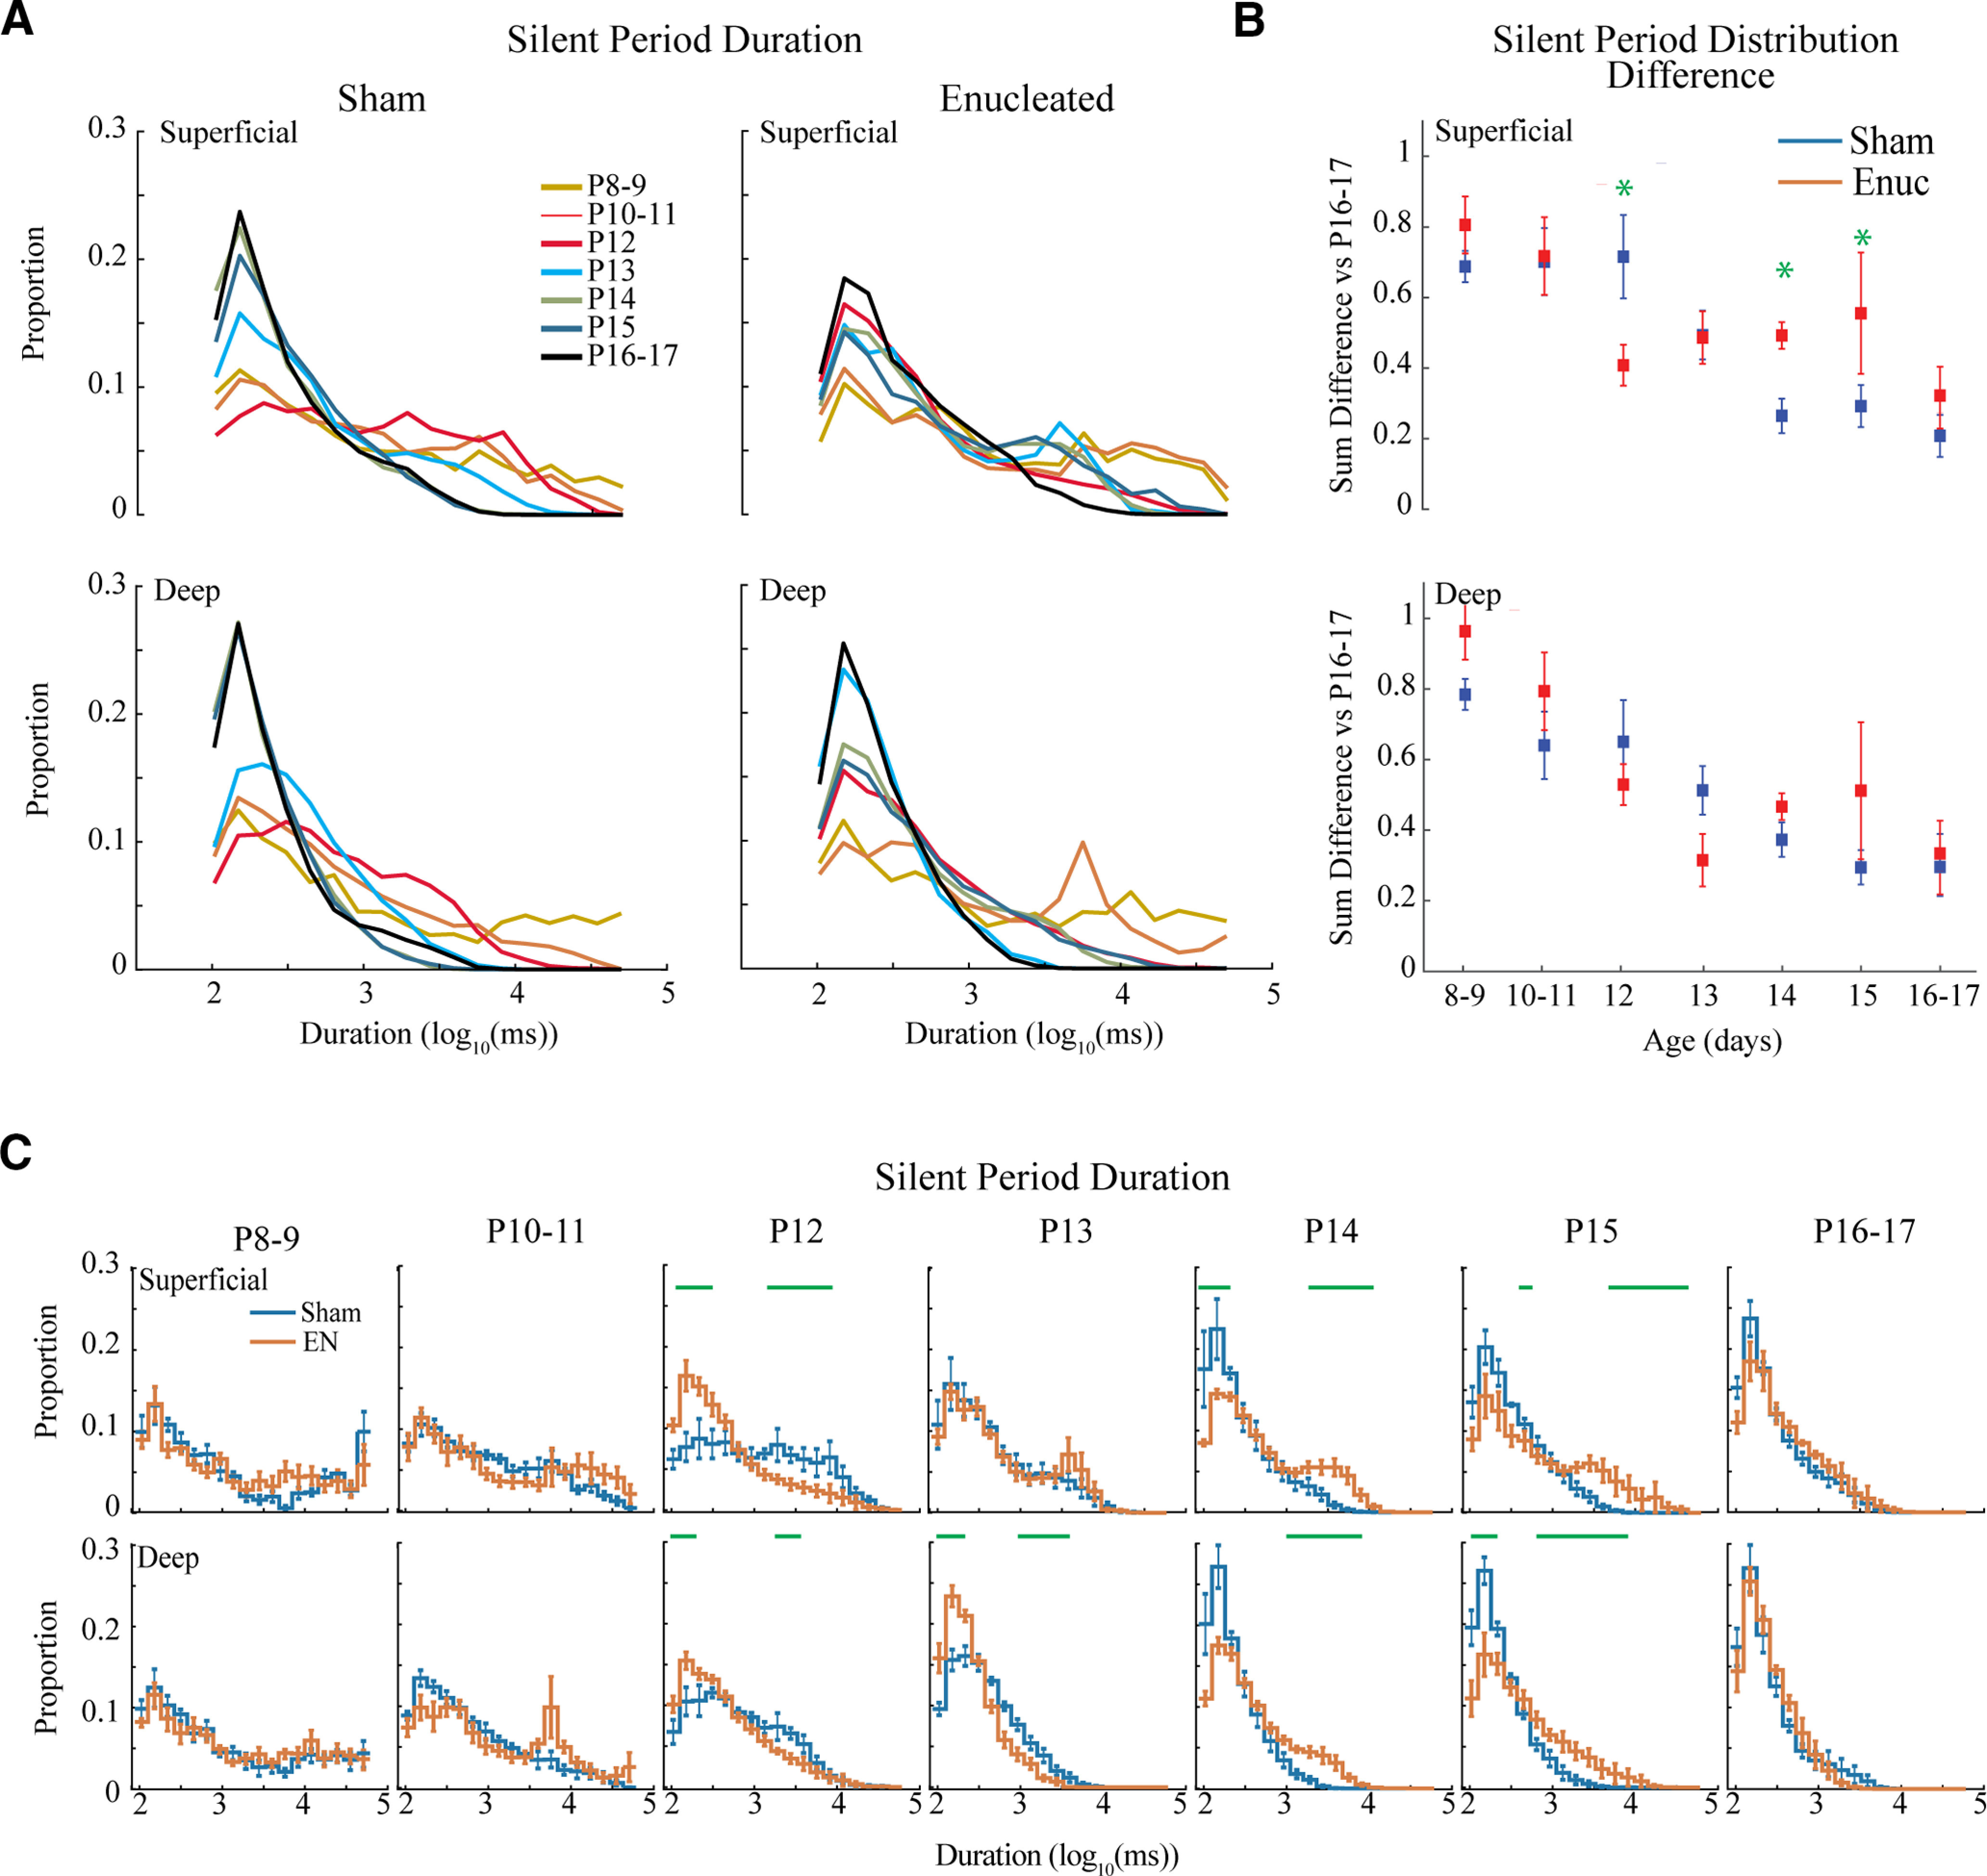
Figure 5.

Development of silent periods. A, Population means of the distributions for silent period duration. Both groups and layers show a robust shift from long duration silent periods to short silent periods over the second and third postnatal weeks. B, Mean ± SD of absolute distribution distance from P16–P17 for each age. Green asterisks indicate significant differences between groups at a given age. C, Population means ± SD of silent period duration distribution by age group. Green lines denote durations with significant differences (permutation analysis) between the groups. Enucleated animals show an increase in short duration silent periods 1 d early (P12 vs P13) but then fail to further eliminate long-duration periods at P14 as sham controls. Both groups have eliminated long duration periods by P16–P17.
