Figure 2.
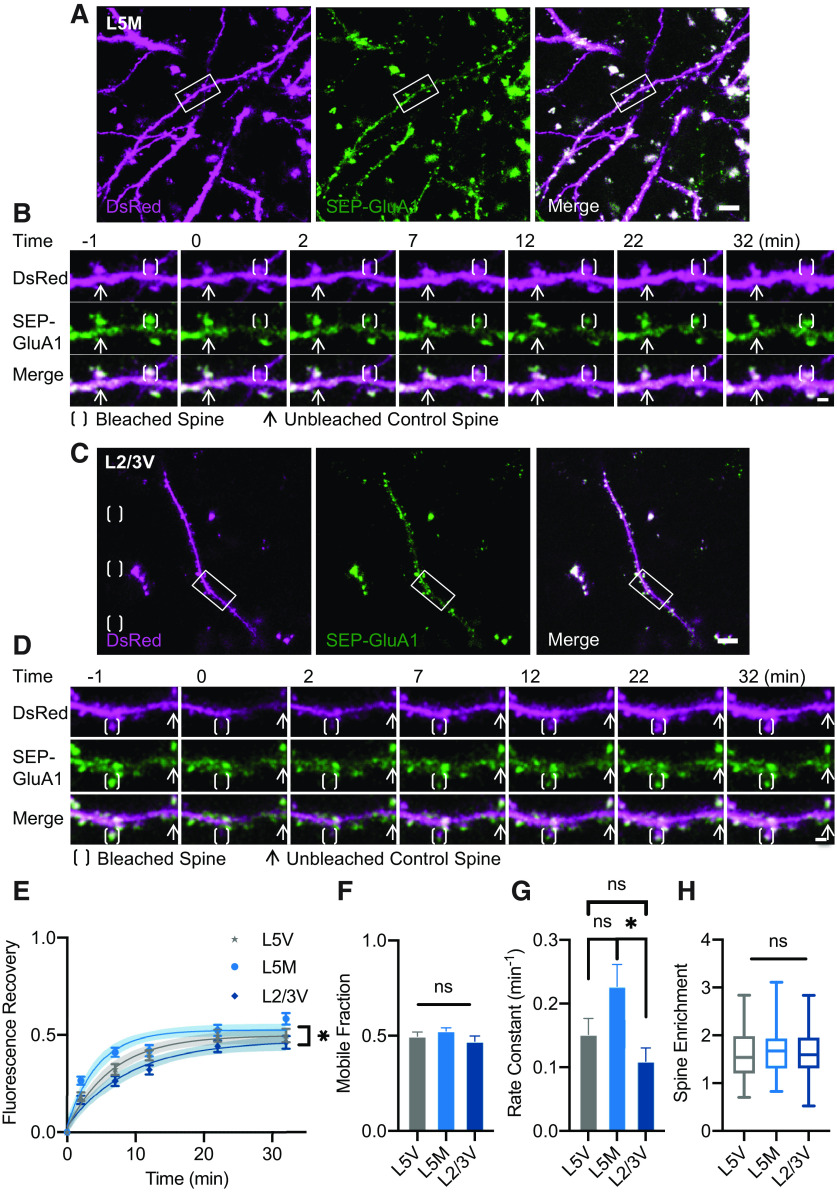
Similar SEP-GluA1 mobility between different cortical regions or layers. A, Representative MIP image of region of L5 motor cortex neurons expressing DsRed cell fill (magenta), SEP-GluA1 (green), and myc-GluA2. Scale bar: 10 μm. Area of interest indicated corresponding to panel B. B, Representative MIP image of bleached spine and fluorescence recovery. Scale bar: 2 μm. C, D, Similar to A, B in L2/3 of visual cortex neurons (scale bars: 10 and 2 μm, respectively). E, Fluorescence recovery of SEP-GluA1 in spines of L5 visual (L5V), L5 motor (L5M), and L2/3 visual (L2/3V) cortices (multifactorial ANOVA; Extended Data Figures 2-3, 2-4). Time points were fitted with an exponential curve indicated by solid line with 95% CI in shaded area. F, Comparison of SEP-GluA1 mobile fraction across regions/layers defined by maximum fluorescence recovery calculated as Ymax of fitted exponential curves in panel E (one-way ANOVA, p = 0.24; Extended Data Figure 2-5). G, Comparison of SEP-GluA1 recovery rate constant across regions/layers defined by k of fitted exponential curves in panel E (one-way ANOVA, Sidak’s multiple comparison tests; Extended Data Figure 2-6). H, Comparison of SEP-GluA1 spine enrichment across regions/layers (one-way ANOVA, p = 0.40; Extended Data Figure 2-7). E–H, L5V n = 104 spines, 4 mice; L5M n = 97 spines, 3 mice; L2/3V n = 84 spines, 3 mice, *p < 0.05, ns = not significant. See also Extended Data Figures 2-1, 2-2, 2-8, 2-9, 2-10, 2-11, 2-12, 2-13.

