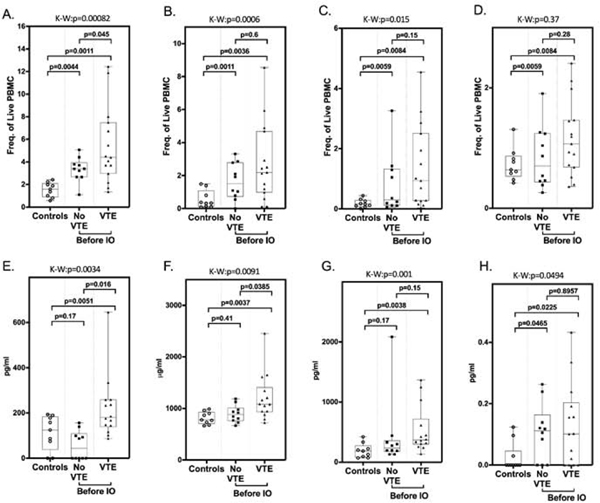
Figure 2. Elevation of total MDSC and soluble biomarkers correlate with VTE after immunotherapy.
MDSC within peripheral blood mononuclear cell fractions from healthy, age-matched donors (controls), and cancer patients before initiation of immunotherapy were quantified by flow cytometry analysis. (A) Total MDSC (CD33+/HLADR−), (B) polymorphonuclear MDSC (CD14−/CD15+), (C) monocytic MDSC (CD14+CD15−), (D) early stage MDSC (CD14−CD15−). Plasma concentrations of immune/inflammatory biomarkers from healthy, age-matched donors “controls” and cancer patients before initiation of immunotherapy. (E) IL-8 (pg/ml), (F) sVCAM-1 (μg/ml), (G) IL-1ra (pg/ml), (H) GM-CSF (pg/ml). Box-and whisker plots show median and 25th and 75th percentiles, minimum and maximum. Kruskal-Wallis (K-W) rank-sum test was used to categorize statistical differences seen between the three groups (VTE, no VTE, controls) with results shown above each graph. Pair-wise two-group analysis was performed using the Wilcoxon rank-sum test. p values are indicated. These studies demonstrate a significantly increased rate of thrombosis in patients with elevated levels of total MDSC, IL-8, sVCAM-1, and GM-CSF compared to normal controls and patients with no VTE.

