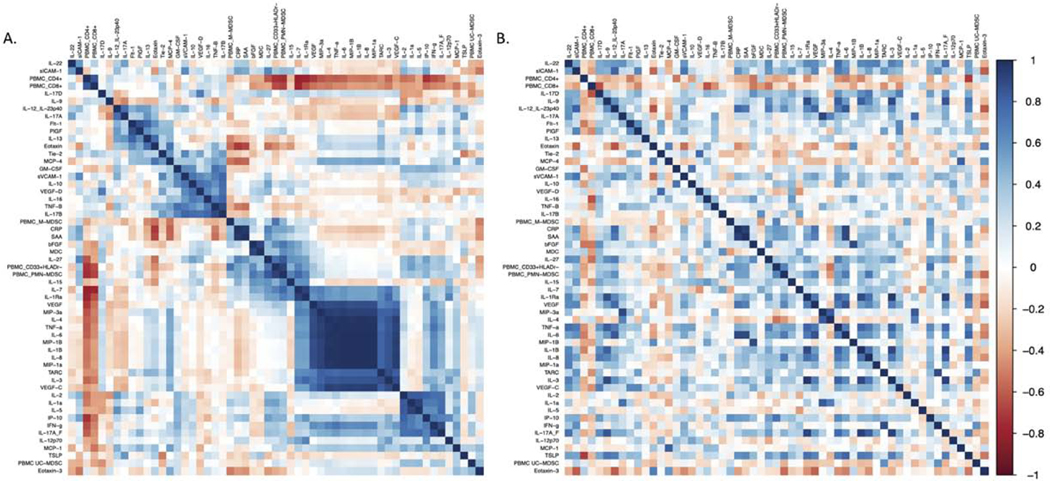
Figure 3: Correlation matrix of MDSCs and soluble plasma analytes associated with VTE in immunotherapy-treated patients with (A) and without (B) VTE.
Pairwise Pearson’s correlations with hierarchical clustering among the absolute plasma analytes and MDSC populations (n=55 parameters in total). Key to the right of the correlation matrix represents the correlation coefficient [ρ= −1 negative correlation (red) to ρ=1 positive correlation (blue)]. The prominent blue square in the right lower quadrant of the matrix in the VTE patients (A) indicates that elevated levels of IL-8 correlate with elevated levels of several other inflammatory cytokines including IL-1β, IL-6 and TNFα. This clustering is not observed in patients without VTE.

