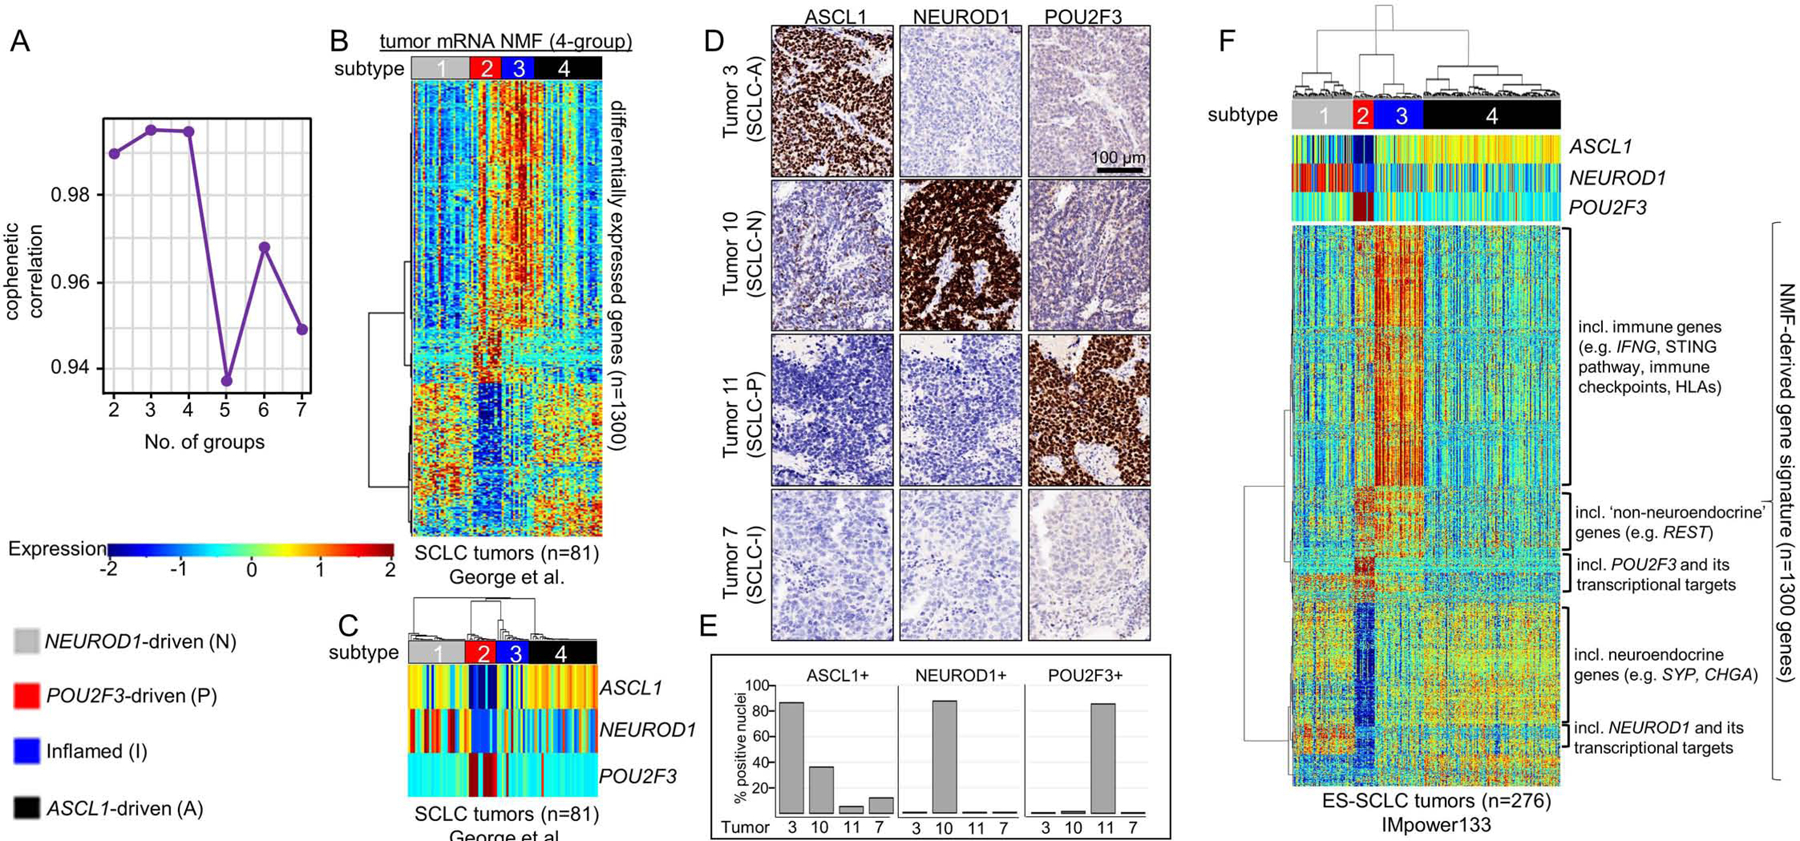
Figure 1: NMF identifies four transcriptional subtypes of SCLC.

Cophenetic correlation from NMF analysis of resected SCLC tumors (A). Differential expression of NMF-selected genes (B) and, specifically, ASCL1, NEUROD1, and POU2F3 (C) across 4 clusters. IHC analysis of consecutive sections of patient SCLC tumor for ASCL1, NEUROD1, and POU2F3 demonstrating staining pattern for example of each of four subtypes (D). Bar graph indicating percentage of tumor cell nuclei positive for ASCL1, NEUROD1, and POU2F3 by IHC in each of four tumors above (E). Application of NMF-derived gene signature to independent ES-SCLC (IMpower133) tumor dataset revealing four SCLC subtypes (F). Sample sizes: n=81 tumors (B-C) and n=276 tumors (F).
