
Figure 2: Molecular and phenotypic distinctions between SCLC subtypes.
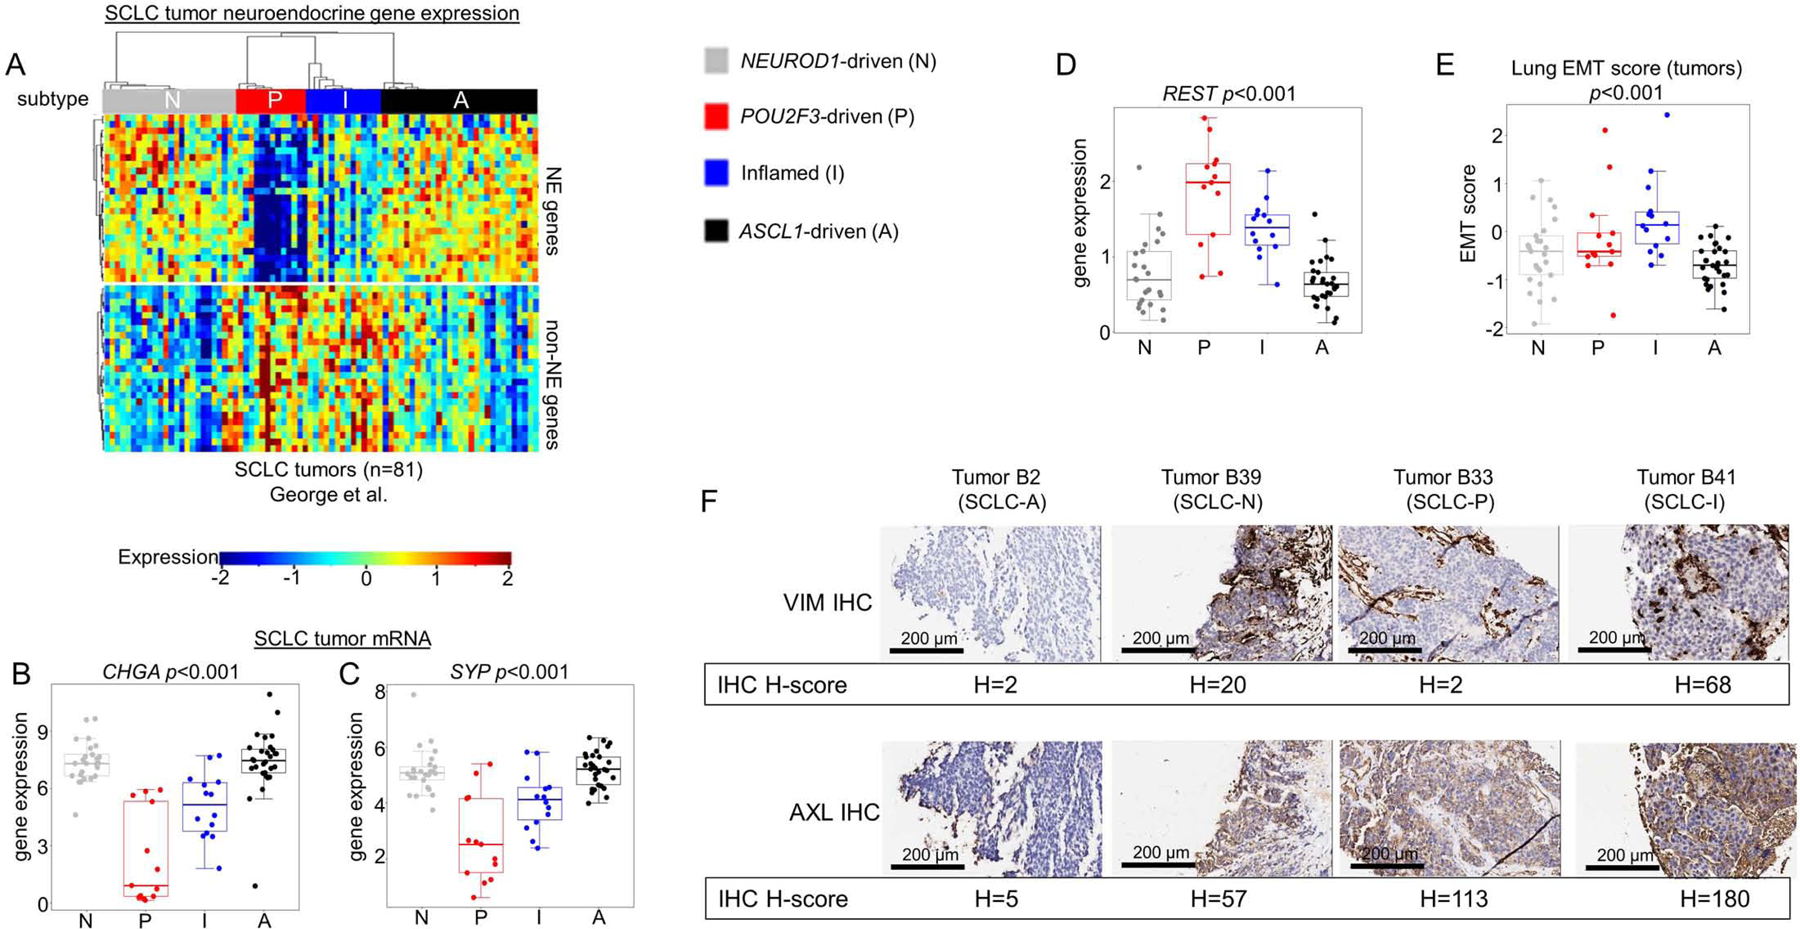
Differential expression of NE and non-NE genes across all SCLC tumors within each subtype (A), including comparison of mean expression of NE markers CHGA (B) and SYP (C) and REST, a transcriptional repressor of NE gene expression (D). Lung-specific epithelial-mesenchymal transition (EMT) score calculated for each SCLC tumor with comparison between mean EMT scores for each subtype (E). IHC analysis of representative tumors from SCLC-A and SCLC-N, as well as n=1 tumors of SCLC-I and SCLC-P, for Vimentin (VIM) and AXL protein expression with associated H-score (F). Sample sizes: n=81 tumors (A-E). p-values are the result of one-way ANOVA. Error bars: +/− 1.5x interquartile range (B-E).