
Figure 3: SCLC-I defines an inflamed subtype of SCLC.
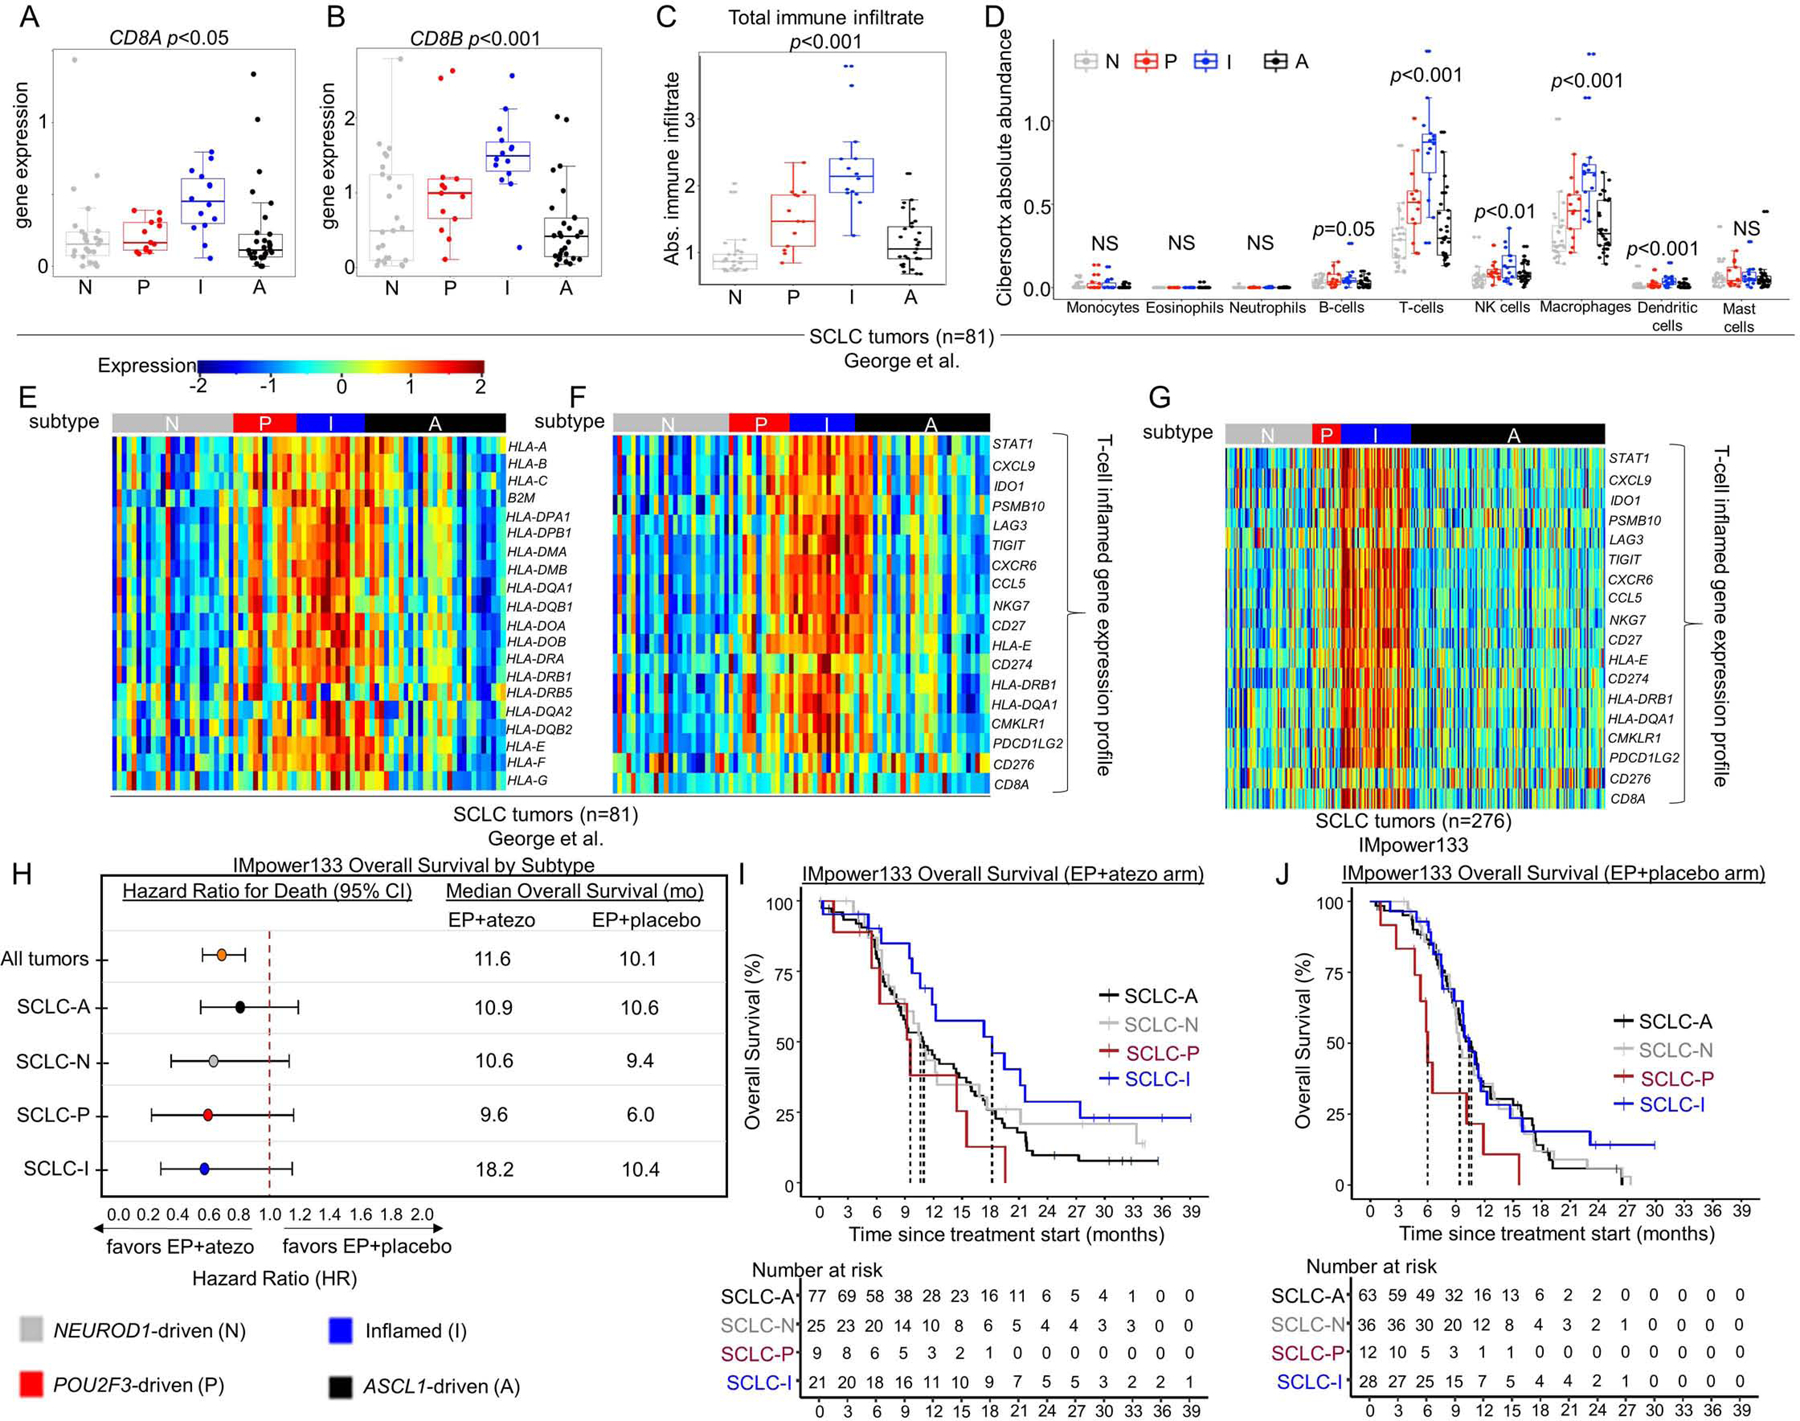
Comparison of mean gene expression of CD8+ T-cell markers (A-B). CIBERSORTx analysis of total immune infiltrate (C) and specific immune cell populations (D). Heatmaps comparing expression of HLA and antigen presenting genes (E) and 18-gene -γ-related T-cell gene expression profile (F) across subtyped SCLC tumors from George et al. Heatmap comparing expression of 18-gene -γ-related T-cell gene expression profile among tumors from IMpower133 (G). Forest plot demonstrating hazard ratios for overall survival and median overall survival values between carboplatin/etoposide + atezolizumab (EP+atezo) and EP+placebo arms in patients from IMpower133 as a collective (all tumors) and by subtype (H). Kaplan-Meier curves on a subtype-by-subtype basis for overall survival in EP+atezo (I) and EP+placebo (J) arms in IMpower133. Sample sizes: n=81 tumors (A-F), 276 tumors (G), and 132 patients (atezo arm) and 139 patients (placebo arm) (H-J). p-values in A-D are the result of one-way ANOVA testing. Error bars: +/− 1.5x interquartile range (A-D) and +/− 95% CI (H).