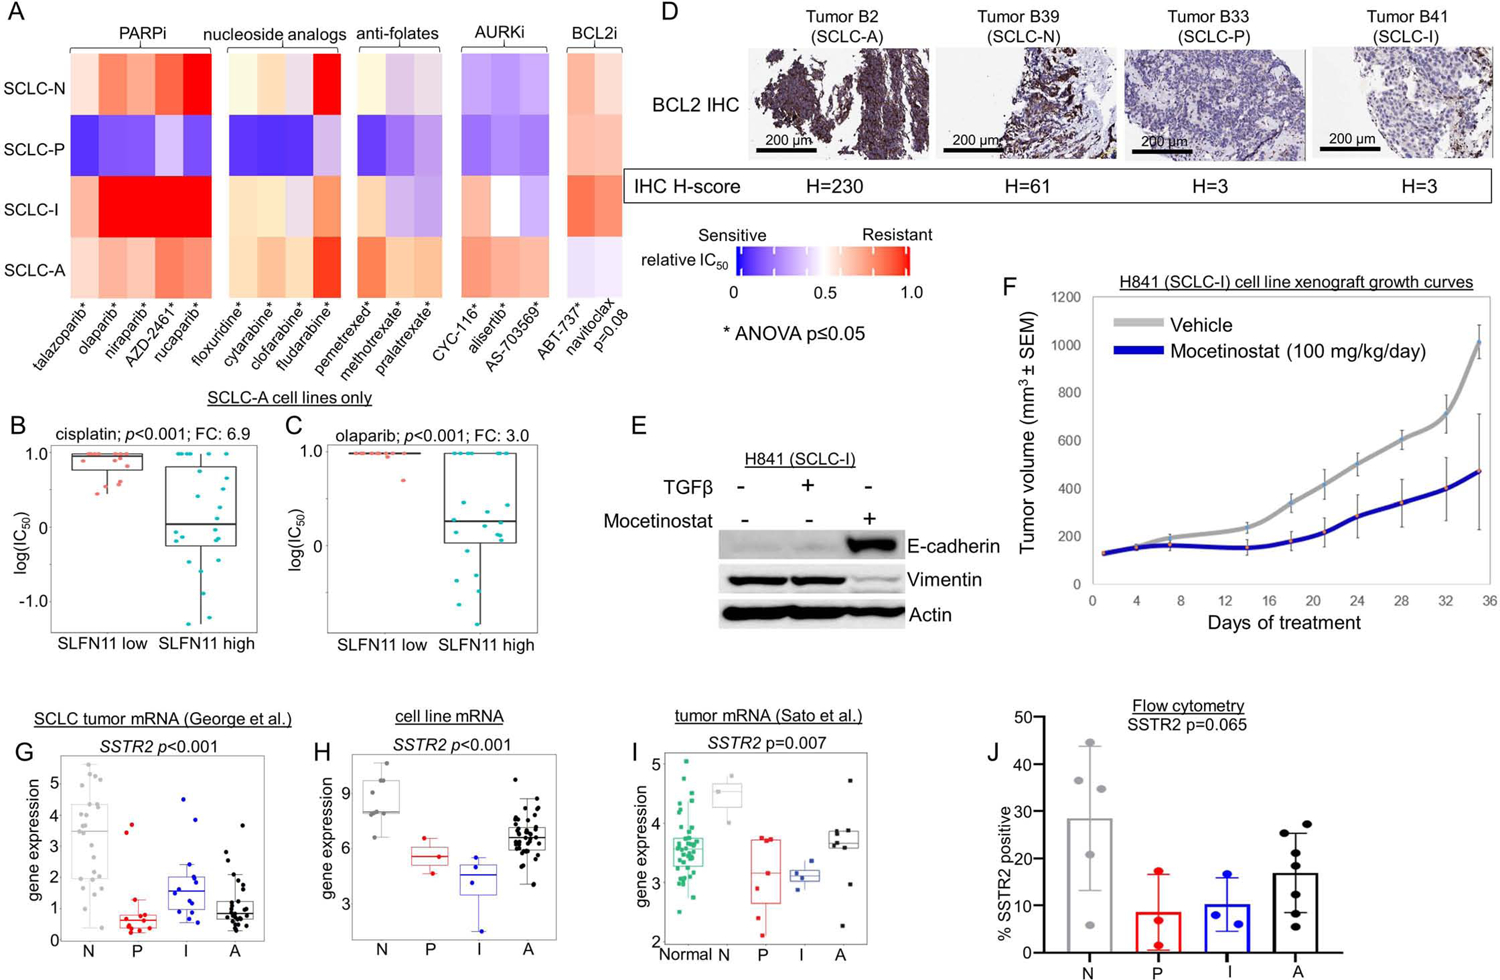
Figure 4. SCLC subtypes possess unique therapeutic vulnerabilities.

Comparison between each SCLC cell line subtype of mean relative in vitro IC50 values for PARP inhibitors, nucleoside analogs, anti-folates, AURK inhibitors, and BCL2 inhibitors (A). Comparison if IC50 values for cisplatin (B) and the PARPi olaparib (C) among SCLC-A cell lines separated into high and low SLFN11 expression. IHC analysis of tumors representing each subtype (representative images for SCLC-A and –N; and n=1 each for SCLC-P and –I) for expression of BCL2, with associated H-score noted (D). Western blot showing expression of E-cadherin and Vimentin in H-841 cell line with addition of TGFβ (EMT inducer) and mocetinostat (E). Murine H841 flank cell line xenograft growth curves with vehicle or mocetinostat treatment (F). Mean expression of the cell surface protein encoding gene SSTR2 in multiple datasets (G-I) along with flow cytometry analysis of proportion of analyzed cells that express SSTR2 protein in subtyped cell lines (J). Sample sizes: n=62 cell lines (A, H), n=38 cell lines (B-C), n=8 mouse tumors per treatment arm 81 tumors (G), n=23 tumors (I), and n=18 cell lines (J). p-values are the result of one-way two-sided T-test (B-C) or one-way ANOVA (A, G-J). Error bars: +/− 1.5x interquartile range (B-C, G-J) or +/− SEM (F).
