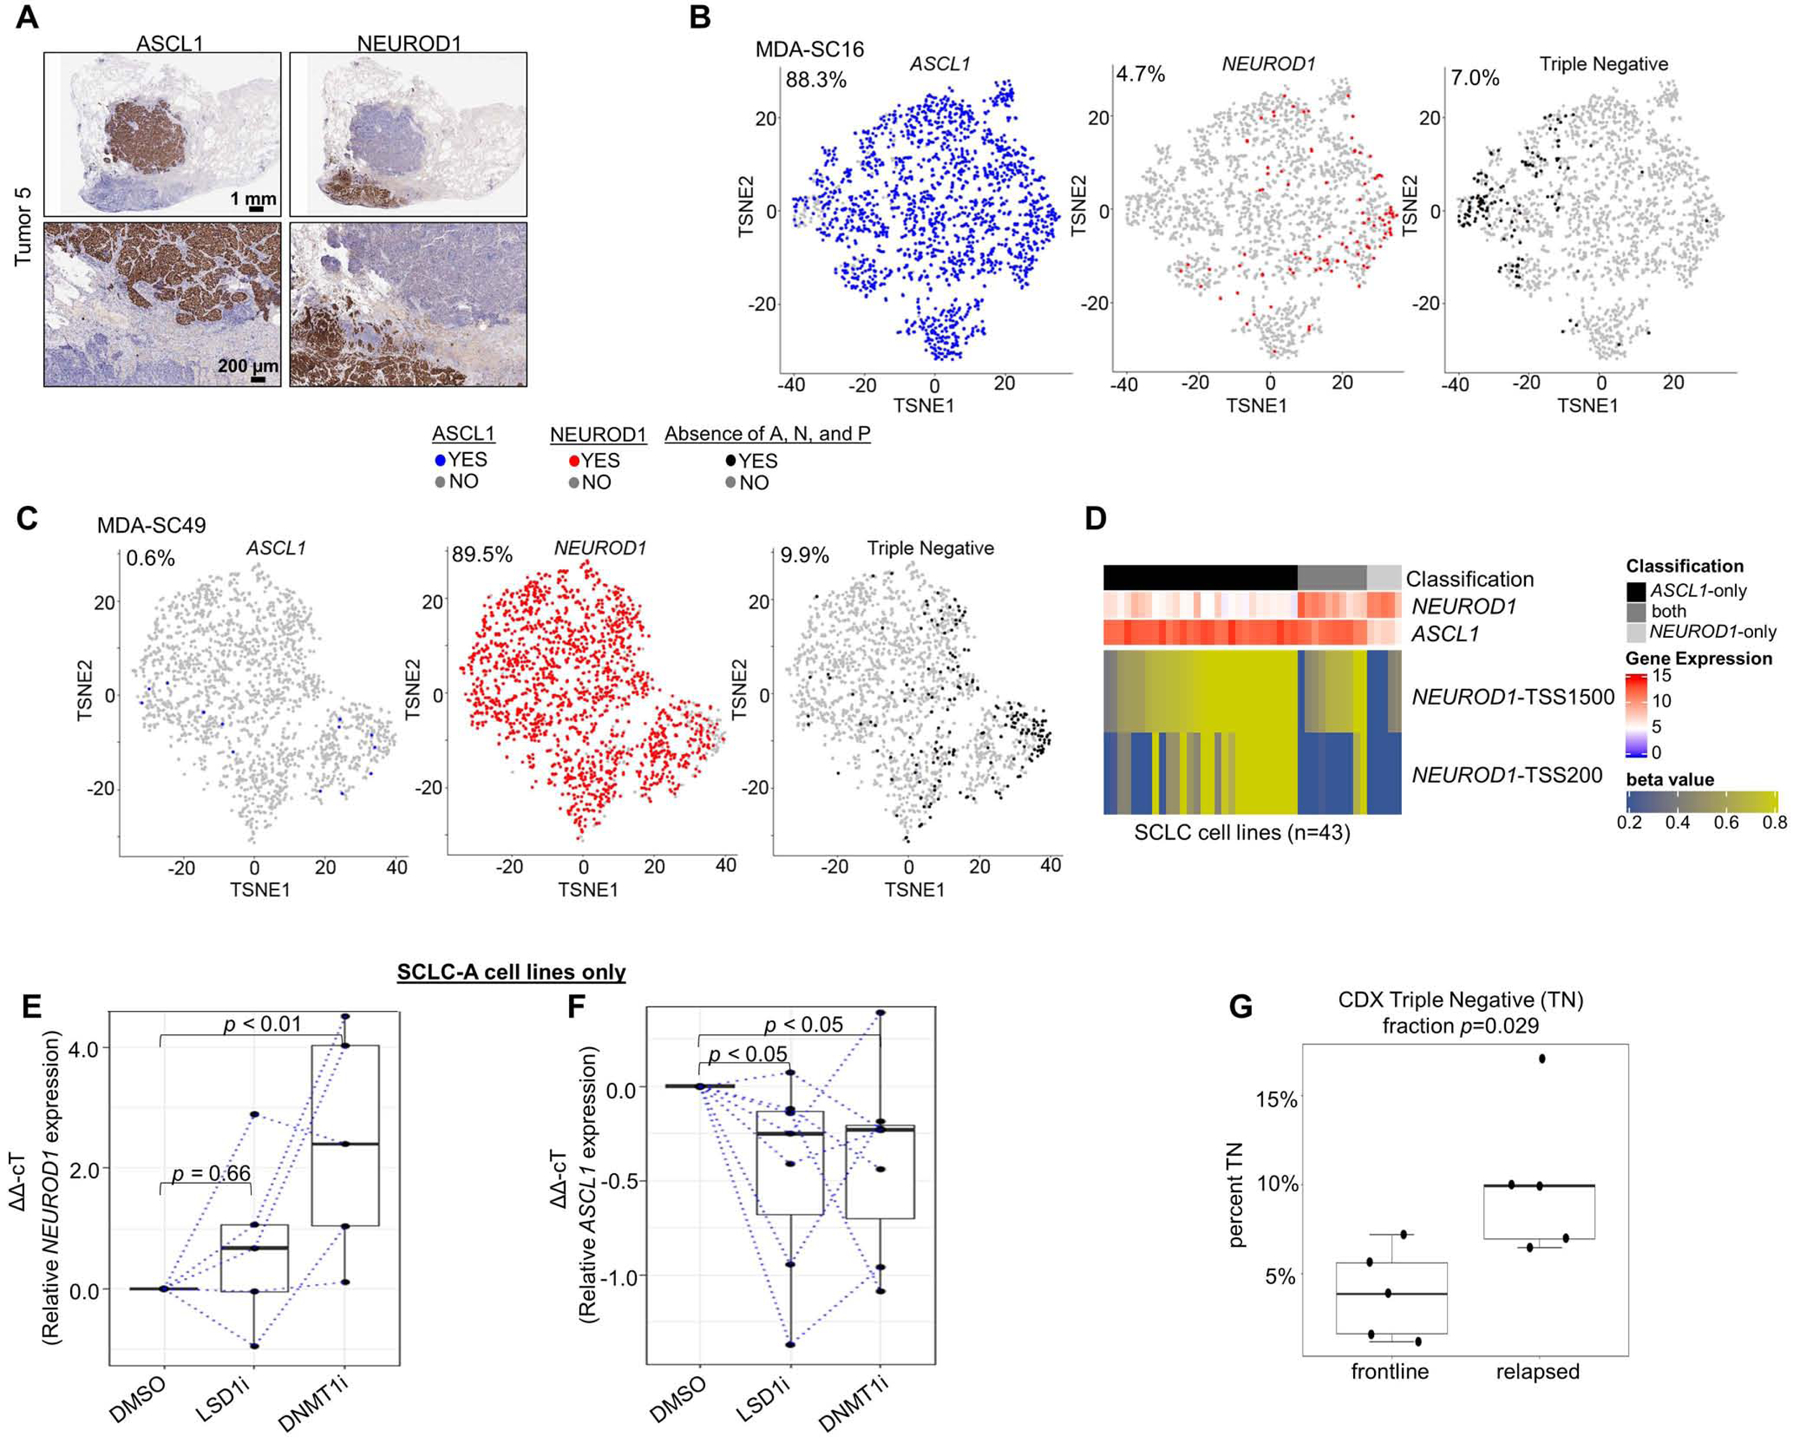
Figure 5: Intratumoral heterogeneity of SCLC subtypes in tumors and tumor-derived models.

Spatially restricted IHC expression patterns of ASCL1 and NEUROD1 in heterogeneous tumor (A). t-SNE feature plots from scRNAseq for ASCL1, NEUROD1, and absence of ASCL1/NEUROD1/POU2F3 (SCLC-I; triple negative) in representative CDX model of SCLC-A (MDA-SC16) (B) and SCLC-N (MDA-SC49) (C) subtypes. Heatmap highlighting differential methylation (beta value) of NEUROD1 promoter both distal and proximal to transcriptional start site (TSS1500 and TSS200, respectively) in cell lines that express ASCL1-only, NEUROD1-only, or both (D). Relative expression of NEUROD1 (E) and ASCL1 (F) among SCLC-A cell lines following treatment with LSD1i and DNMT1i. Comparison of mean fraction of SCLC-I (triple-negative) cells from scRNAseq between CDXs derived from relapsed SCLC patients SCLC (relapsed) and those derived from never treated/currently frontline treated patients (frontline) (G). Sample sizes: n=2000 cells (B-C), n=28 cell lines (D), n=5 cell lines (E), and n=10 tumors (G). p-values are the result of Wilcoxon Rank Sum Test (E-F) or two-tailed T-test (G). Error bars: +/− 1.5x interquartile range (E-F) or +/− SEM (G).
