
Figure 6. Emergence of SCLC-I populations coincides with cisplatin resistance in SCLC-A predominant xenograft models.
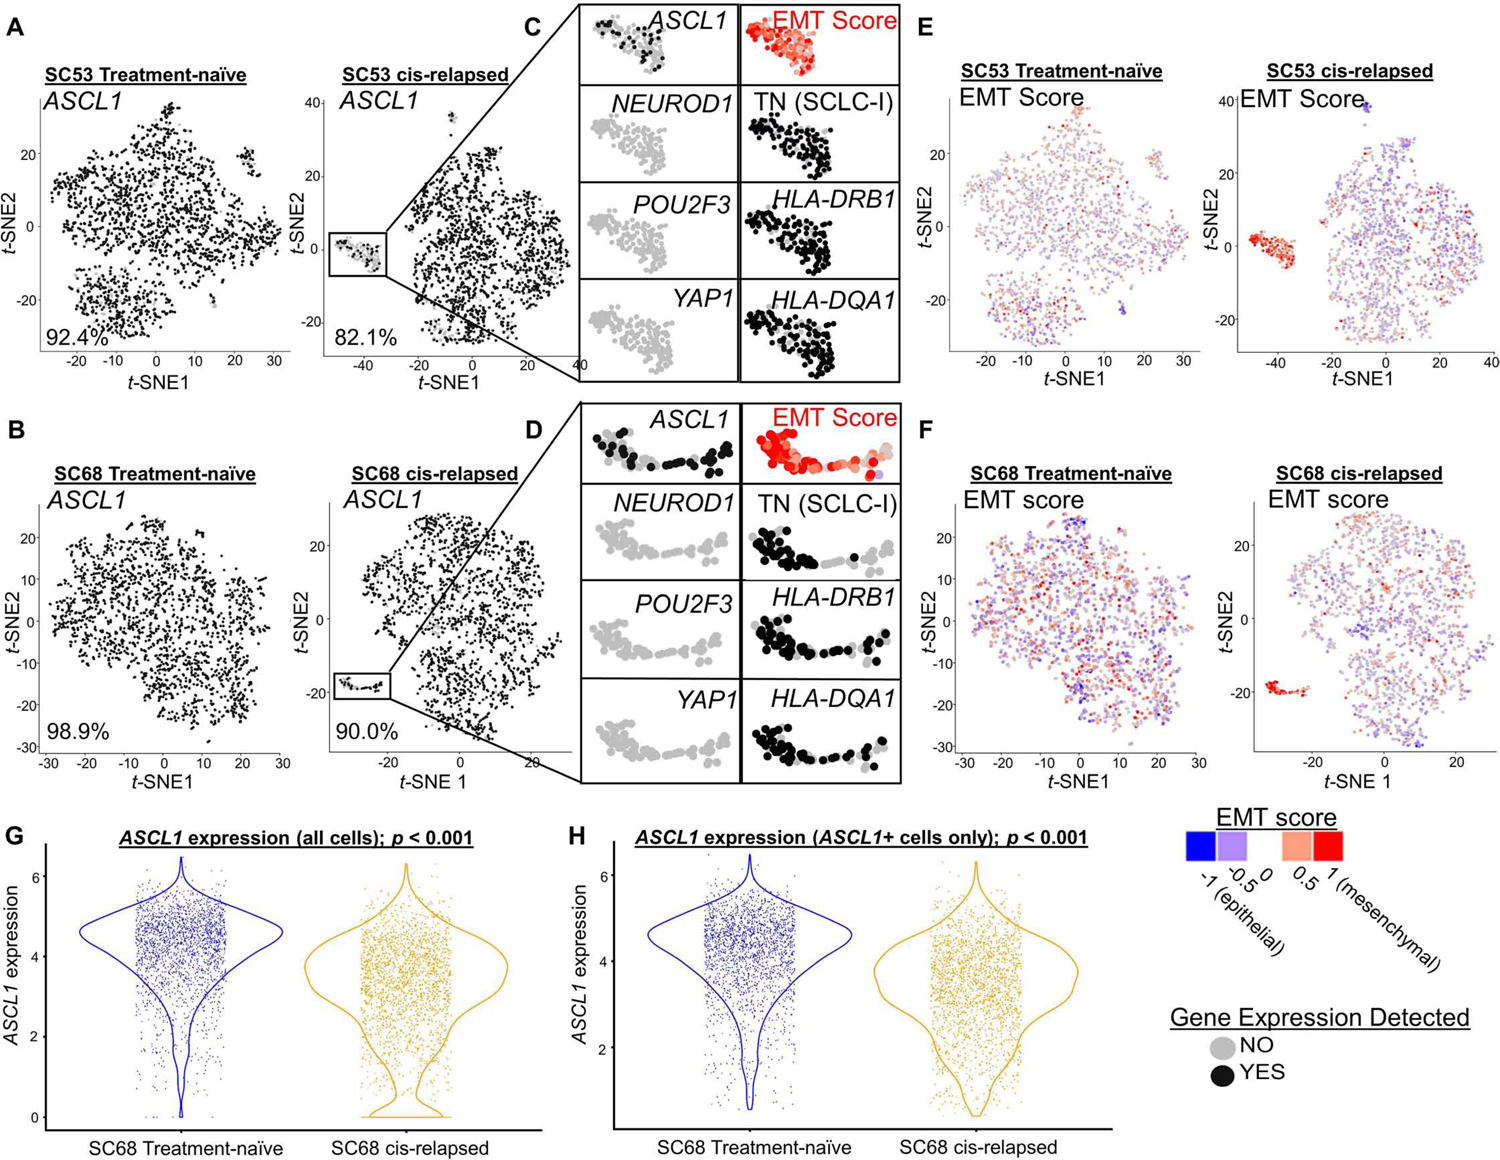
t-SNE feature plots from scRNAseq for ASCL1 comparing parental, treatment-naive and cisplatin-resistant/relapsed (cis-relapsed) CDX models (MDA-SC53, A; MDA-SC68, B). Highlighted portion of A and B illustrates distinct cluster with prominent ASCL1 loss (C, D). The cells in this region are now triple-negative (SCLC-I), with high EMT score (E, F). Violin plots comparing ASCL1 expression between MDA-SC68 treatment-naïve and cisplatin-relapsed xenograft tumors in all cells (G) and only ASCL1-positive cells (H). Sample sizes: n=2000 cells per arm. (A-H). p-values are the result of two-tailed T-test (G-H).