
Figure 7: Emerging SCLC-I populations support tumor-wide resistance via transcriptional plasticity.
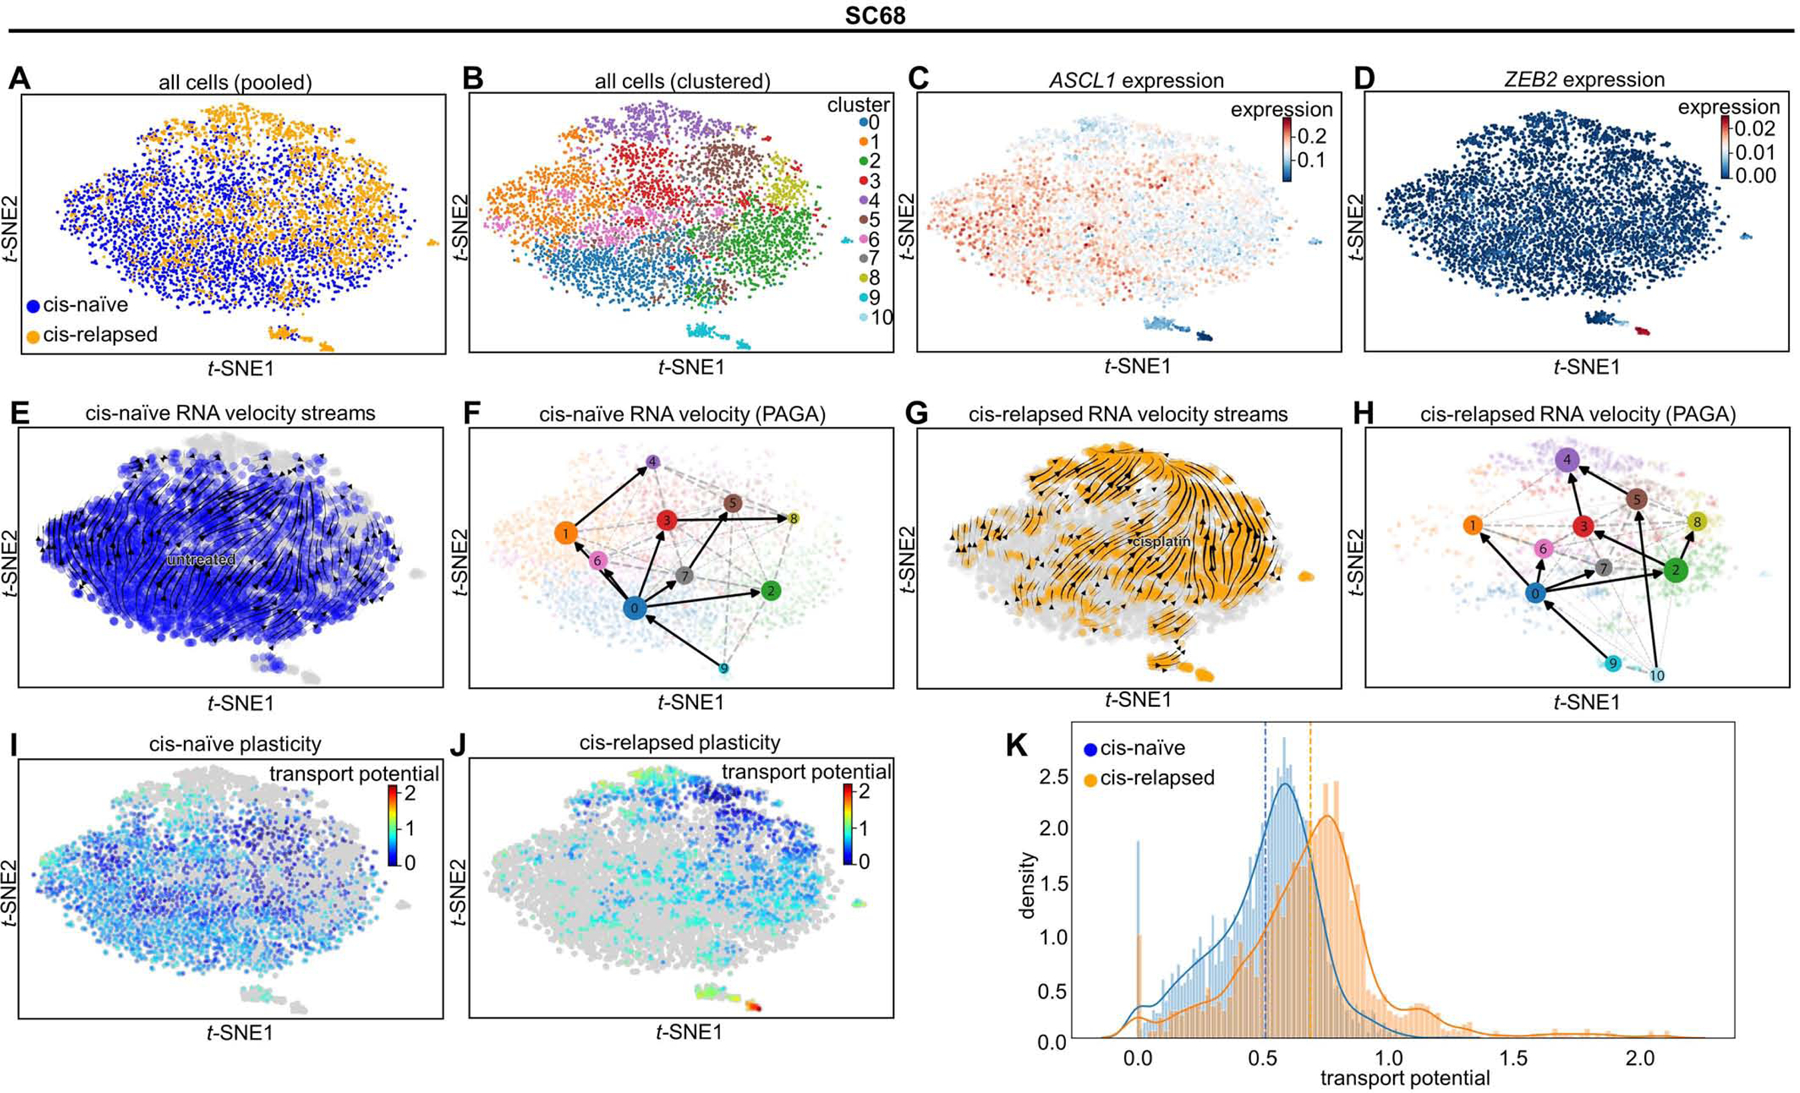
tSNE projection of all cells from MDA-SC68 CDXs with treatment history (A) or Leiden clustering assignment (B) denoted. Expression of ASCL1 (C) and ZEB2 (D) in these cells. Note the upper right, composed largely of cisplatin-relapsed cells, demonstrates lower ASCL1 expression, while the island clusters are essentially ASCL1-null. RNA velocity vector streams and PAGA maps for cells from cisplatin-naïve (E-F) and cisplatin-relapsed (G-H) CDX tumors. Cell plasticity, as measured by cell transport potential, for cells from cisplatin-naïve (I) and cisplatin-relapsed (J) tumors highlighting areas of greatest plasticity in island cluster within relapsed tumor. Comparison of transport potential between cisplatin-naïve and –relapsed cells (K) demonstrating higher overall plasticity in cisplatin-relapsed cells. Sample sizes: n=2000 cells per arm.