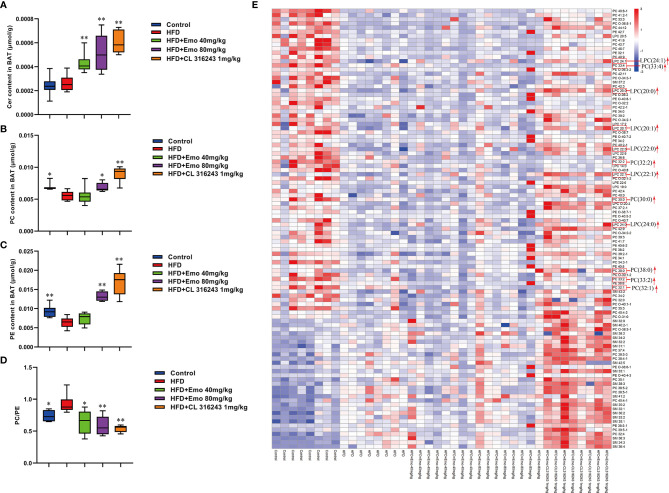
Figure 6.
Effects of emodin on the lipid metabolites in BAT of HFD mice. (A) The content of Cer in BAT. (B) The content of PC in BAT. (C) The content of PE in BAT. (D) The ratio of PC : PE in BAT. (E) Heat map. Only metabolites with VIP >1 and P <0.05 were selected in heat map, and different shades of color present the concentration (red, white and blue presented the high, normal and low concentration). The red up arrow indicates up regulation or promotion. HFD, high fat diet; Emo, emodin; PC, Phosphatidylcholine; PE, phosphatidylethanolamine; Cer, ceramides. Data are expressed as mean ± SE. * P < 0.05, ** P < 0.01 vs. HFD group.

