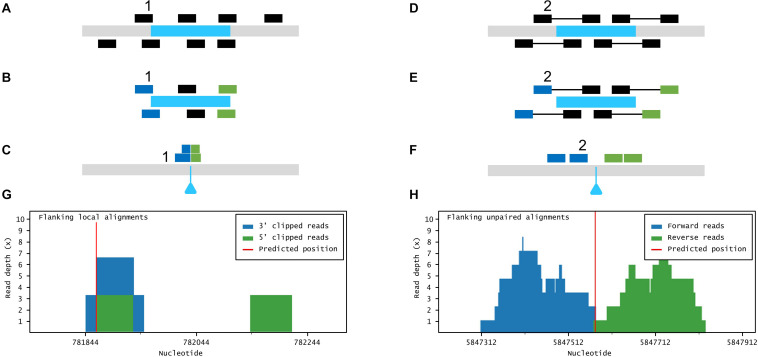
FIGURE 3.
Large insertion mapping with Easymap. (A–C) Local alignment analysis. (A) The DNA insert appears in blue, over genomic DNA in gray. Individual reads are taken from the mutant genome. (B) The reads are aligned to the insertion sequence. Locally aligned reads (e.g., 1) are selected and sorted according to the end that is truncated (in blue and green). (C) The selected reads are aligned to the genomic reference sequence. The blue triangle indicates the position of the insertion in the mutant genome. (D–F) Paired-read analysis. (D) Paired reads are taken from the mutant genome. (E) The reads are aligned to the insertion sequence. Unaligned reads with aligned mates (e.g., 2) are selected and sorted according to their position in relation to the insertion (in blue and green). (F) The selected reads are aligned to the reference sequence, delimiting a candidate region for the insertion site. (G,H) Read depth histograms for examples of local alignment (G) and paired-read analyses (H). (G) False-positive insertion, characterized by low overall read depths and disorganized data. (H) True-positive insertion, characterized by high read depths and organized data.

