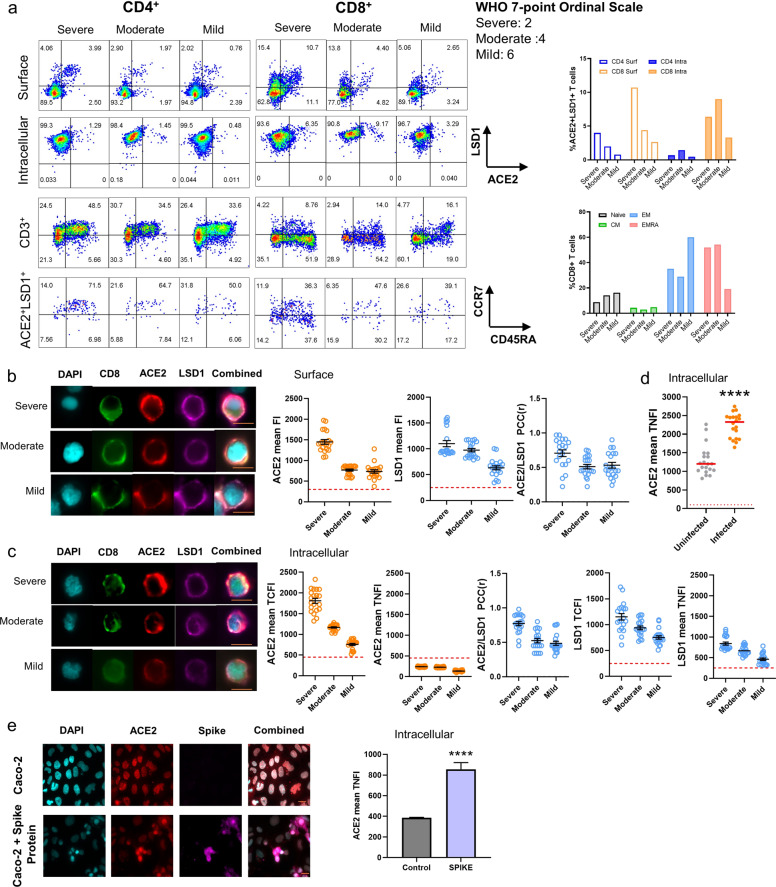
Fig. 3. LSD1 co-localizes with ACE2 in SARS-CoV-2-infected primary cells.
a FACS analysis of cell surface and intracellular expression of ACE2 and LSD1 and the cell subset composition of T cells in COVID-19 patient PBMCs (n = 3). The bar graph indicates the percentage ACE2+LSD1+ cells in the total Caco-2 population and each cell subset frequency of the total CD8+ T cells. b Representative image of PBMCs derived from COVID-19 patients using the ASI digital pathology system. Cells were not permeabilized (surface) for immunostaining for CD8, LSD1, and ACE2. DAPI (blue) was used to visualize nuclei. Scale bar, 12 μm (inset). Dot plot quantification of the fluorescence intensity (cell surface) of ACE2 and LSD1 in COVID-19 patient PBMCs (n = 3). >50 cells were analyzed for each patient sample. c Representative image of PBMCs derived from COVID-19 patients using the ASI digital pathology system. Cells were permeabilized (intracellular) for immunostaining for CD8, LSD1, and ACE2. DAPI (blue) was used to visualize nuclei. Scale bar, 12 μm (inset). Dot plot quantification of the fluorescence intensity (cytoplasmic and nuclear) of ACE2 and LSD1 in COVID-19 patient PBMCs (n = 3). >50 cells were analyzed for each patient sample. d Dot plot quantification of the fluorescence intensity (nuclear) of ACE2 in uninfected or SARS-CoV-2-infected Caco-2 cells. >50 cells were analyzed for each group. Mann–Whitney-test: ∗∗∗∗P < 0.0001 denote significant differences. e The ASI digital pathology system was used to analyze ACE2 expression in Caco-2 cells treated with the SARS-CoV-2 spike protein. Dot plots displays the nuclear fluorescence intensity in Caco-2 cells for ACE2 in control cells or cells positive for the spike protein. n > 1000 cells counted per group. Data represent mean ± SEM. Mann–Whitney test. ∗∗∗∗P < 0.0001 denotes significant differences. n.s. non-significant.

