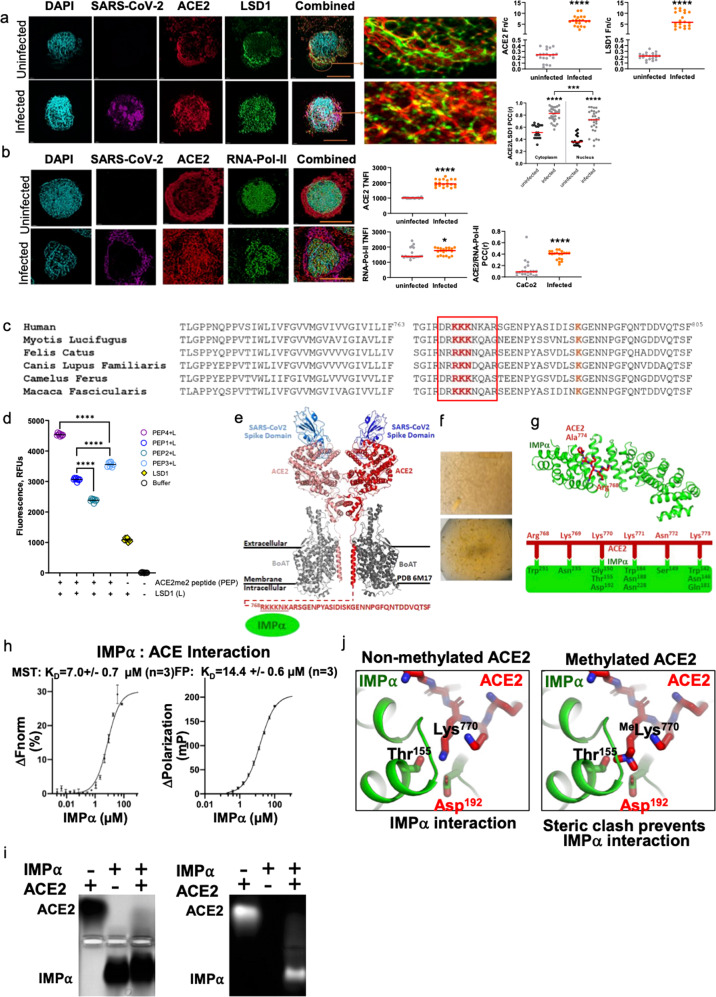
Fig. 4. LSD1 directly interacts with ACE2.
a Representative image of uninfected or SARS-CoV-2-infected Caco-2 cells using the Andor WD Revolution Inverted Spinning Disk microscopy system. Cells were permeabilized (intracellular) for immunostaining for ACE2, LSD1, and SARS-CoV-2 N (nucleocapsid). DAPI (blue) was used to visualize nuclei. Scale bar, 12 μm (inset). The ratio of nuclear to cytoplasmic staining (Fn/c) was also calculated for LSD1 and ACE2: >1 indicates nuclear bias, whereas <1 indicates cytoplasmic bias. The PCC was calculated to assess colocalization in Caco-2 cells with/without infection in the cytoplasmic or nuclear compartments (n = 20 cells analyzed). Data are mean ± SEM. Mann–Whitney test: ∗∗∗P < 0.001, ∗∗∗∗P < 0.0001 denote significant differences. b Representative image of uninfected or SARS-CoV-2-infected Caco-2 cells using the Andor WD Revolution Inverted Spinning Disk microscopy system. Cells were permeabilized (intracellular) for immunostaining for ACE2, RNA Pol-II, and SARS-CoV-2 N (nucleocapsid). DAPI (blue) was used to visualize nuclei. Scale bar, 12 μm (inset). Dot plot quantification of the fluorescence intensity of ACE2 and RNA Pol-II in uninfected or SARS-CoV-2-infected Caco-2 cells. >50 cells were analyzed for each group. The PCC was calculated for colocalization (n = 20 cells were analyzed). Mann–Whitney test: ∗P < 0.05, ∗∗∗∗P < 0.0001 denote significant differences. c Representative conservation of the ACE2 c-terminal sequence across multiple species. An NLS (red box) is identified with three lysines highly likely to be subject to acetylation/demethylation (red). This region may be involved in protein stabilization as there is also a nearby lysine (in orange) highly likely to be ubiquitinated for proteasomal degradation. d ACE2me2 peptide substrate demethylation by LSD1. LSD1 activity was measured by demethylation assay with ACE2me2 peptide of PEP1, PEP2, PEP3, or PEP4. Fluorescent was measured at 40 s intervals on a Synergy H4 multi-mode plate reader. The background rate of ACE2me2 peptide was subtracted in corresponding samples. Statistical significance was calculated using one-way ANOVA, ∗∗∗∗P < 0.0001 denote significant differences. e The C-terminal, cytoplasmic domain of ACE2 contains a putative NLS. This region was unresolved in the recently determined structure (PDB 6M17). Shown is a cartoon representation of the ACE2 structure and the sequence of the unresolved C-terminal domain of ACE2. Underlined residues represent the putative NLS. f Crystals of importin-α bound to FITC-Ahx tagged ACE2 used in diffraction and structure determination. g Structure of importin-α bound to ACE2. Importin-α, shown in cartoon mode (green), bound to ACE2, shown in stick mode (red). Interacting residues are schematically presented with the same color scheme as above. Zoom inset shows that Lys770 forms a critical interaction with the P2 site of importin-α, and methylation of this site would form steric clashes. h Microscale thermophoresis (left) and fluorescence polarization (right) was used to assess the strength of binding between importin-α and ACE2. Each experiment was carried out with an n = 3, with the KD shown representing the mean and standard deviation. i The electrophoresis mobility shift assay was carried out to confirm the interaction between IMPα and ACE2 via the C-terminal domain. ACE2 C-terminal domain is FITC labeled. Left panel is Coomassie stained, right panel is visualized by UV. j Depicts 3D model of ACE2 interaction with importin-α via the NLS in the C-terminal region at Lysine 769, 770, and 771. This model demonstrates that methylation of these lysines would cause steric hindrance and prevent interaction, indicating that ACE2 methylation and non-methylation are important for the importin-α interaction.

