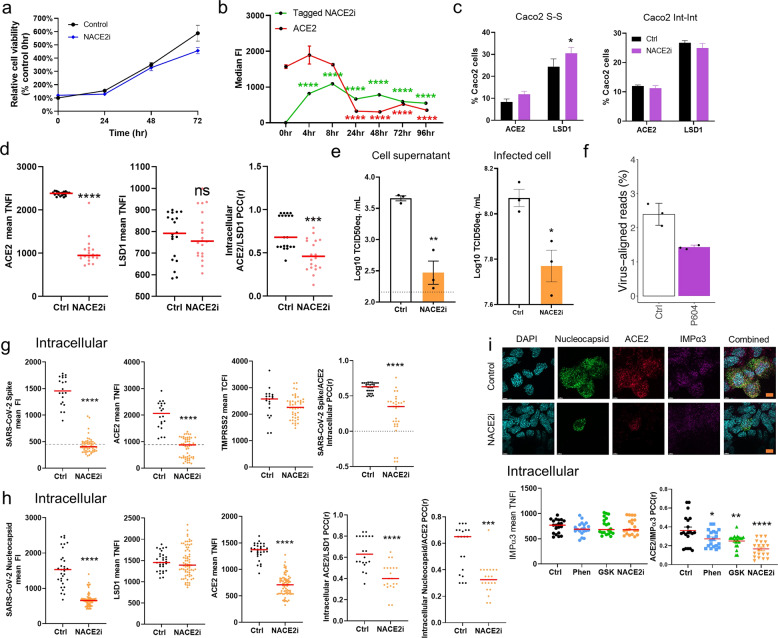
Fig. 5. A novel ACE2 peptide inhibitor.
a Cell proliferation analysis of Caco-2 control (depicted in Fig. 3) and NACE2i (50 μM)-treated cells over a 72 h period. Proliferation was analyzed using WST-1 reagent and absorbance read after 2 h incubation. The graph depicts relative cell proliferation from triplicates expressed as a percentage of control cells (untreated, 0 h). Statistical significance was calculated using one-way ANOVA at each time point. b The ASI Digital pathology system was used to analyze ACE2 expression over time in Caco-2 cells treated with NACE2i (with FAM5 TAG). Dot plots displays the nuclear fluorescence intensity in Caco-2 cells for ACE2 and FAM5 tag as well as the % population of ACE2-expressing cells, >20 cells counted per group. Data represent mean ± SEM. Mann–Whitney test. ∗∗∗∗P < 0.0001 denote significant differences. c FACS analysis of cell surface and intracellular expression of ACE2 and LSD1 in Caco-2 cells treated with/without NACE2i for 48 h. The bar graph indicates the percentage ACE2+ or LSD1+ cells of the total Caco-2 population. Data are mean ± SEM (n = 3). Mann–Whitney test. ∗P < 0.05 denote significant differences. d Dot plot quantification of the fluorescence intensity (intracellular) of ACE2 and LSD1 in Caco-2 cells with NACE2i treatment. >50 cells were analyzed for each group. The PCC was calculated for colocalization (n = 20 cells were analyzed). Mann–Whitney-test: ∗∗∗P < 0.001, ∗∗∗∗P < 0.0001 denote significant differences. e qRT-PCR analysis to detect replicates of SARS-CoV-2 RNA in Caco-2 culture supernatants and infected cells at the indicated time points post-infection. The quantity of viral genome is expressed as TCID50 equivalents/mL. Data represent mean ± SEM, n = 3. One-way ANOVA, ∗P < 0.05, ∗∗P < 0.01 denote significant differences. f SARS-CoV-2 levels in infected Caco-2 cells. The percentage of virus-aligned reads (over total reads) is indicated for each sample. Error bars represent standard deviation from three independent biological replicates. g Dot plot quantification of the fluorescence intensity (intracellular) of SARS-CoV-2 spike, ACE2, LSD1, and TMPRSS2 in SARS-CoV-2-infected Caco-2 cells with phenelzine, GSK, or NACE2i treatment. >50 cells were analyzed for each group. The PCC was calculated to assess colocalization (n = 20 cells were analyzed). Data are mean ± SEM. Mann–Whitney-test: ∗∗∗∗P < 0.0001 denote significant differences. h Dot plot quantification of the fluorescence intensity (intracellular) of SARS-CoV-2 nucleocapsid, ACE2, and LSD1 in SARS-CoV-2-infected Caco-2 cells with phenelzine, GSK, or NACE2i treatment. >50 cells were analyzed for each group. The PCC was calculated to assess colocalization (n = 20 cells were analyzed). Data are mean ± SEM. Mann–Whitney-test: ∗∗∗P < 0.001, ∗∗∗∗P < 0.0001 denote significant differences. i Representative image of uninfected or SARS-CoV-2 infected Caco-2 cells using the Andor WD Revolution Inverted Spinning Disk microscopy system. SARS-CoV-2-infected Caco-2 cells with phenelzine, GSK, or NACE2i treatment, followed by permeabilization (intracellular) for immunostaining for SARS-CoV-2 nucleocapsid, ACE2, and IMPα3. DAPI (blue) was used to visualize nuclei. Scale bar, 12 mm (inset). Dot plot quantification of the fluorescence intensity of IMPα3 in SARS-CoV-2-infected Caco-2 cells. >50 cells were analyzed for each group. The PCC was calculated to assess colocalization (n = 20 cells were analyzed). Data are mean ± SEM. Mann–Whitney test: ∗P < 0.05, ∗∗P < 0.01, ∗∗∗∗P < 0.0001 denote significant differences.

