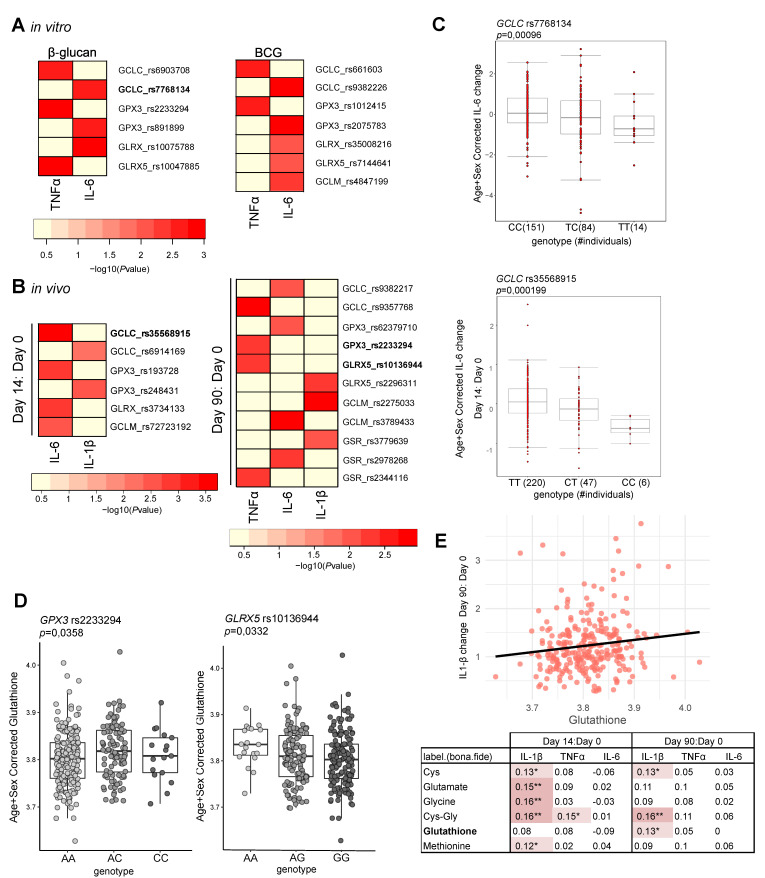
Figure 3.
Glutathione is associated with trained immunity features. Heatmap of the p-values of association (p < 9.99 × 10⁻³) between SNPs mapped to genes involved in glutathione metabolism and the magnitude of cytokine production capacity by monocytes trained in vitro with (A) β-glucan and BCG (n = 251 healthy volunteers for IL-6 and n = 238 healthy volunteers for TNFα) and (B) in vivo BCG training responses (n = 278 healthy volunteers). (C) Boxplot of the lowest p-value SNP per analysis (rs7768134, rs35568915). (D) Boxplots showing glutathione plasma levels (corrected for age and sex) stratified by genotype for rs2233294 (GPX3) and rs10136944 (GLRX5, n = 302). The p-value for each SNP is derived from linear regression model with the SNP of interest as independent variable and glutathione (corrected for age and sex) as the dependent variable. (E) Spearman correlations between circulating metabolites at baseline involved in glutathione metabolism versus fold changes of PBMC-derived S. aureus-induced IL-6, IL-1β, and TNFα responses measured at 14 or 90 days after BCG vaccination compared to baseline (n = 297 healthy volunteers). The table presents the Spearman’s rho for each correlation, and the correlations in red highlight significant positive correlations (* p < 0.05, ** p < 0.01). The correlation between glutathione concentration and the fold change of IL-1β production at 90 days compared to day 0 is given as an example in a scatter plot.

