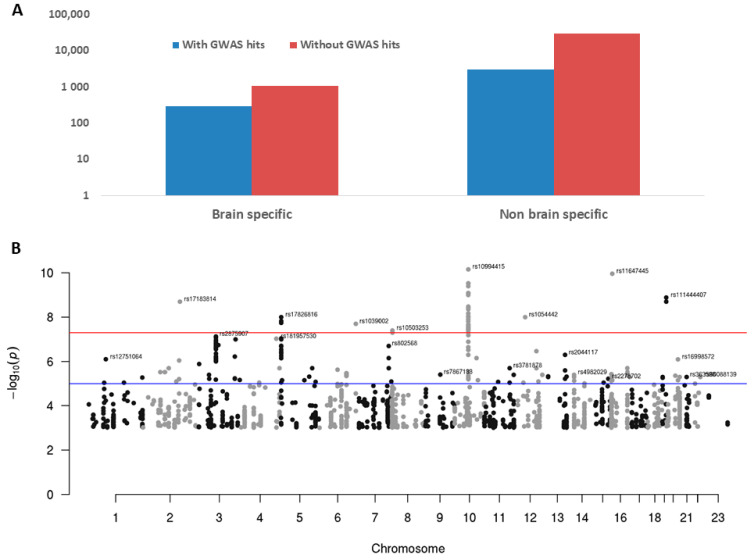
Figure 7.
Bipolar GWAS hits in brain-specific genes. (A) GWAS hits in brain-specific genes vs. non-brain-specific genes (21.42% vs. 9.45%). Note: Y axis is log10 scaled to show the low numbers of brain-specific genes; however, the relative heights of the bars may distort their true absolute numbers. (B) Manhattan plot for GWAS hits mapped to brain-specific genes. Y-axis is −log10 (p value) from GWAS studies. Red line for genome-wide significant level (p value 5 × 10⁻⁸) and blue line is for suggestive p value of 1 × 10⁻⁵.

