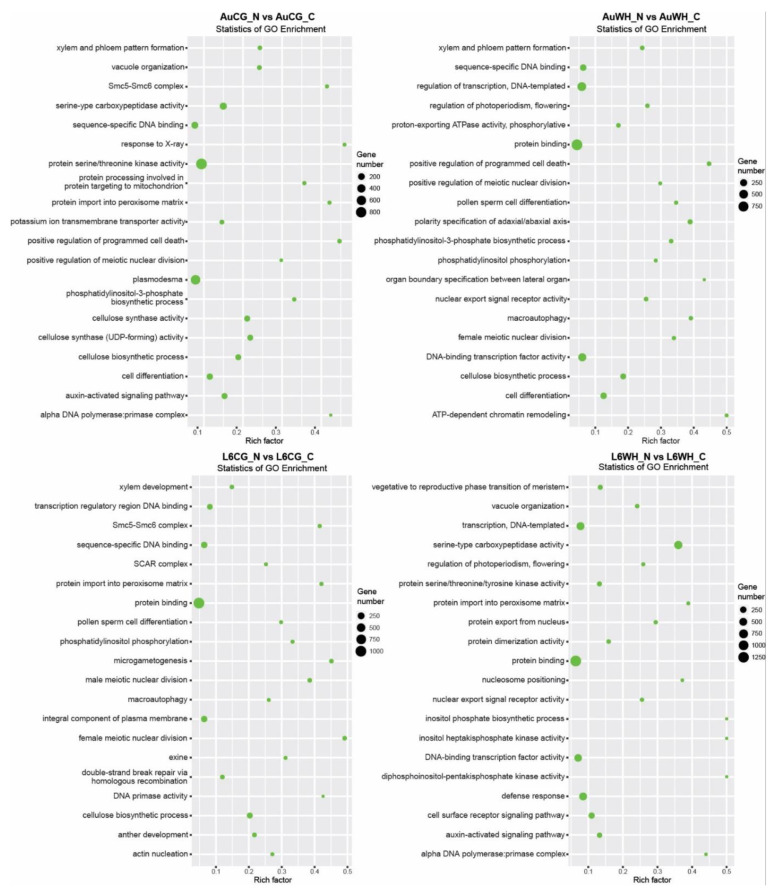
Figure 3.
GO enrichment scatterplots of gene transcripts targeted by miRNAs responsive to the progeny N starvation factor. The treatment groups are: AuCG_C (DBA Aurora control parents, progeny treated with the control), AuCG_N (DBA Aurora control parents, progeny treated with N starvation), AuWH_C (DBA Aurora water-deficit and heat stress parents, progeny treated with the control), AuWH_N (DBA Aurora water-deficit and heat stress parents, progeny treated with N starvation), L6CG_C (L6 control parents, progeny treated with the control), L6CG_N (L6 control parents, progeny treated with N starvation), L6WH_C (L6 water-deficit and heat stress parents, progeny treated with the control), and L6WH_N (L6 water-deficit and heat stress parents, progeny treated with N starvation). Scatter dot size represents the number of targets annotated with a specific GO term. Rich factor represents the degree of enrichment (higher rich factor represents higher degree of gene enrichment).

