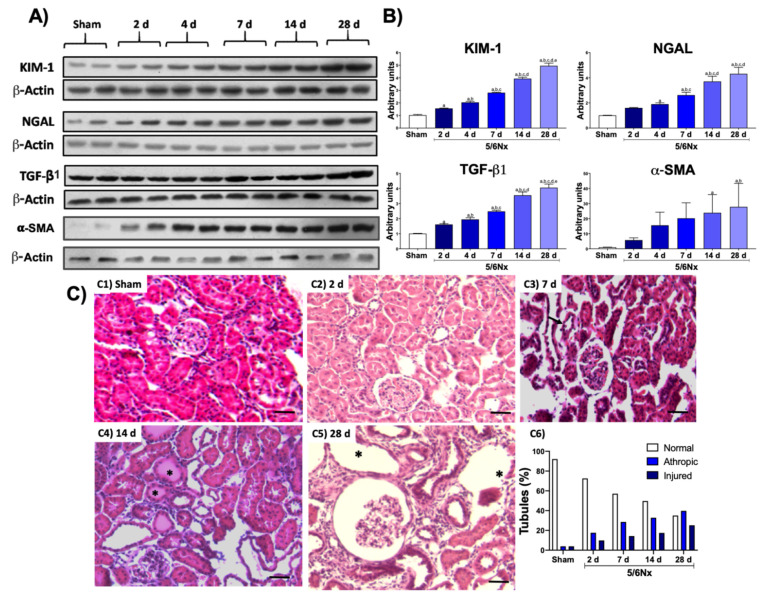
Figure 1.
Temporal progression of kidney damage. (A) Representative Western blots of renal damage markers and fibrotic markers. (B) Quantifications of renal damage markers kidney injury molecule-1 (KIM-1) and neutrophil gelatinase-associated lipocalin (NGAL), as well as the profibrotic molecule transforming growth factor beta (TGF-β1) and alpha smooth muscle actin (α-SMA). β-Actin was used as loading control. Data are the mean ± SEM, n = 4. Tukey test. a = p ≤ 0.05 vs. sham, b = p ≤ 0.05 vs. 2 days, c = p ≤ 0.05 vs. 4 days, d = p ≤ 0.05 vs. 7 days, e = p ≤ 0.05 vs. 14 days, sham = simulated operation/control group. (C) Representative micrographs of kidney: (C1) Normal kidney histology from sham animal. (C2) After 2 days of 5/6 nephrectomy (5/6Nx), there were occasional cortical proximal tubules with flattened epithelium that correspond to tubular atrophy (arrows). (C3) After 1 week of nephrectomy, more tubules showed extensive epithelium damage (arrows). (C4) After 2 weeks of kidney resection, even more tubules show epithelial damage with hyaline casts in their lumen (asterisks). (C5) After 5/6Nx, there were numerous atrophic and dilated tubules (asterisks), as well as a glomerulus with mesangial hypercellularity surrounded by mild inflammatory infiltrate and fibrosis. (C6) The morphometric determination of tubular damage confirmed the progressive tubular damage when compared with the sham simulated/control group (S). (H/E staining, all micrographs 200× magnification, scale magnification bar = 50 µm).

