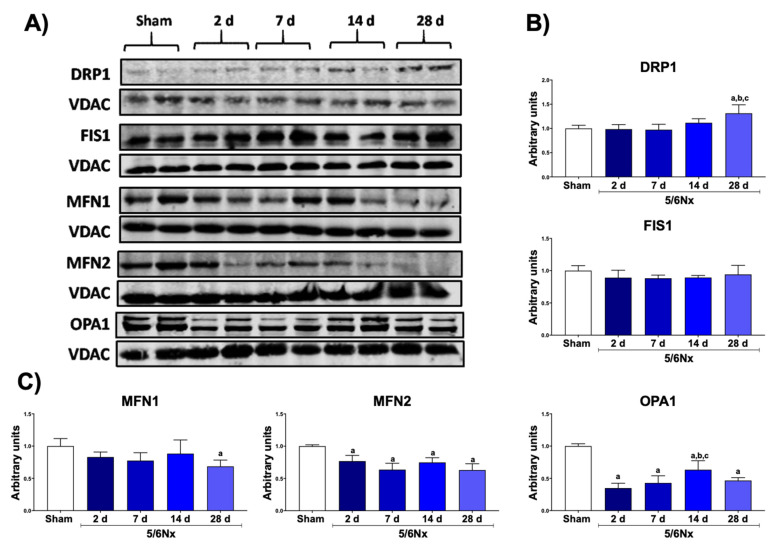
Figure 3.
Alteration in mitochondrial dynamics in remnant renal mass. (A) Representative Western blots of the fission and fusion proteins. (B) Quantification of the fission proteins: dynamin-1-like protein (DRP1) and mitochondrial fission 1 protein (FIS1). (C) Quantification of the fusion proteins: mitofusin 1 (MFN1) and 2 (MFN2) and optic atrophy 1 (OPA1). Voltage-dependent anion channel (VDAC) was used as loading control. Data are the mean ± SEM, n = 4. Tukey test. a = p ≤ 0.05 vs. sham, b = p ≤ 0.05 vs. 2 days, c = p ≤ 0.05 vs. 4 days, 5/6Nx = 5/6 nephrectomy, d = days after 5/6Nx, sham = simulated operation/control group.

