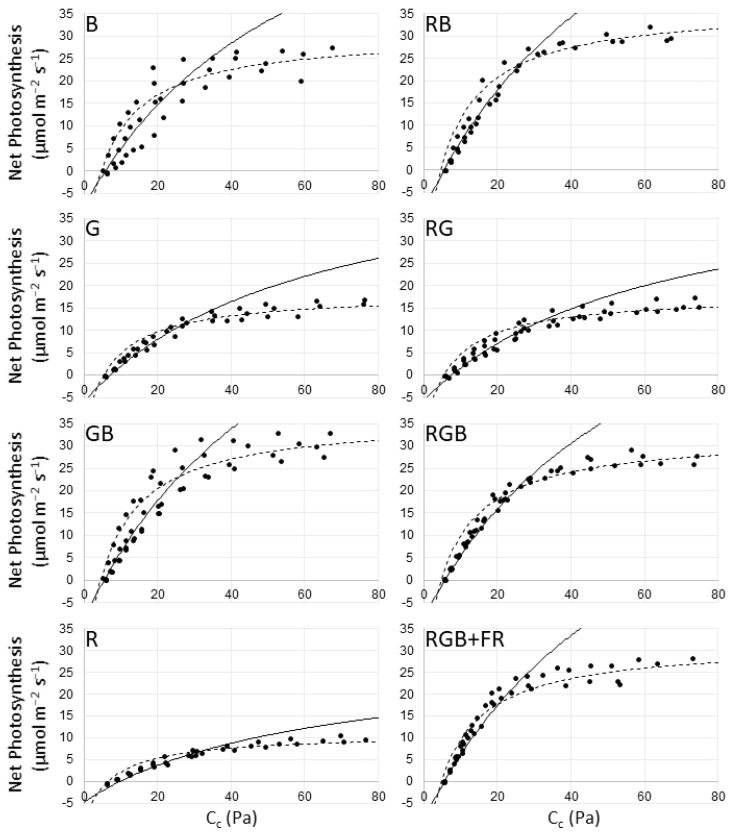
Figure 1.
Net photosynthesis (A) vs. cellular CO2 concentration (Cc) curve fitting for each light treatment. Filled circles represent observed net photosynthesis (A) relative to calculated Cc values. The solid line shows Rubisco limitation, while the dotted line fits RuBP limitation. Triose-phosphate utilization (TPU) limitation was not apparent.

