Figure 1.
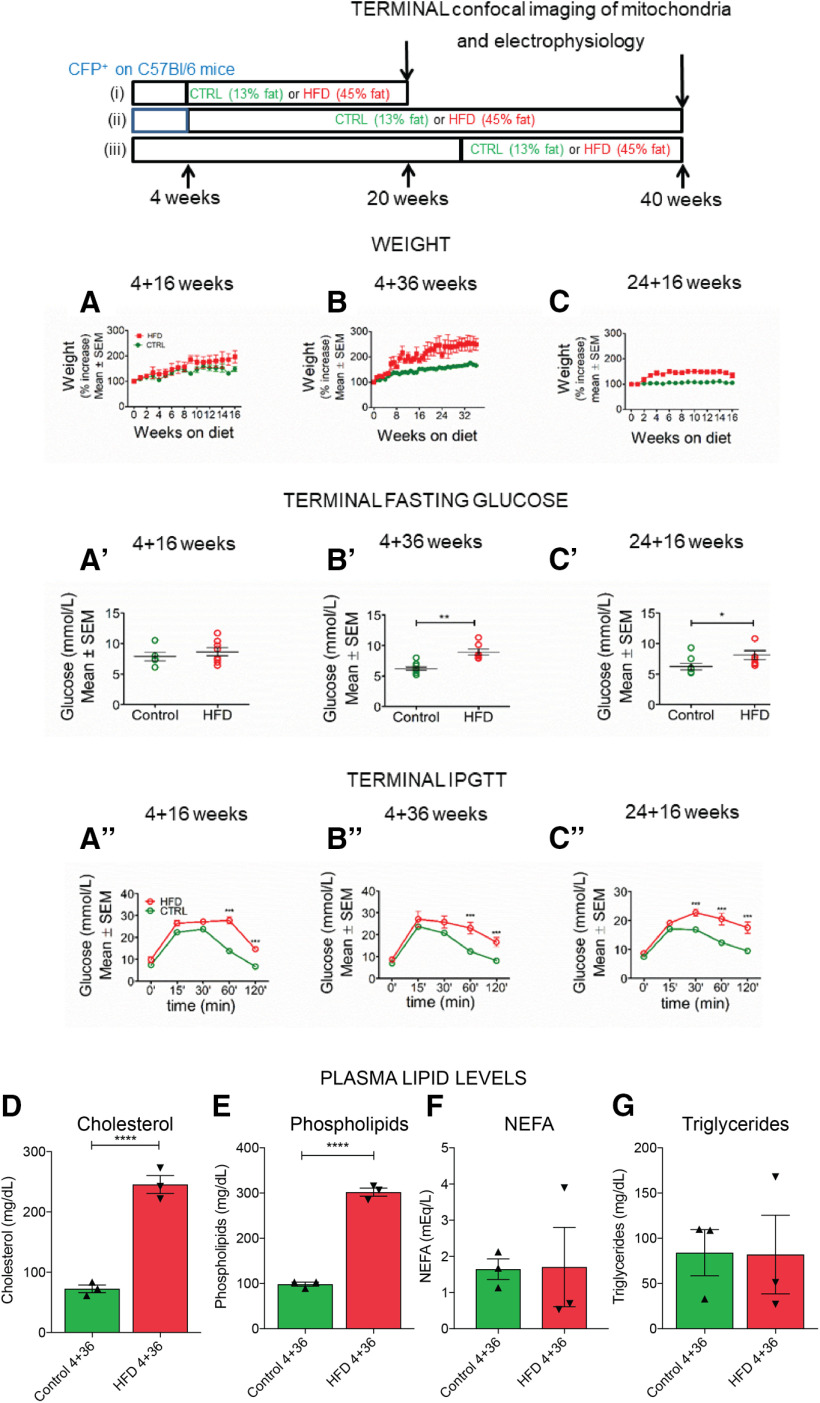
HFD mice exhibit weight gain and impaired glucose tolerance typical of prediabetes. Top, Scheme of the three experimental groups: (i) mice fed HFD from 4 weeks of age for 16 weeks (4 + 16 weeks); (ii) mice fed HFD from 4 weeks of age for 36 weeks (4 + 36 weeks); and (iii) mice fed HFD from 24 weeks of age for 16 weeks (24 + 16 weeks). The control diet and HFD fatty acid composition are provided in Extended Data Figure 1-1. Respective control mice received control chow. At the endpoint, mitochondrial transport and morphology, and axonal [Ca2+]i, were measured in vivo along with electrophysiological measurements. A, B, HFD 4 + 16 and 4 + 36 mice gain more weight than their respective controls, and the percentage weight increase is significant starting from 15 and 19 weeks of HFD, respectively, and onwards. p < 0.001 (two-way ANOVA). n = 5-28 animals per time point. C, HFD 24 + 16 mice gain more weight than their respective controls, and the percentage weight increase is significant starting from 3 weeks of HFD and onwards. p < 0.001 (two-way ANOVA). n = 3-10 animals per time point. A′, Terminal fasting blood glucose (FBG) at the experiment endpoint in HFD 4 + 16 mice was not significantly different to the controls (n = 5 control, n = 8 HFD). B′, Terminal FBG in HFD 4 + 36 mice was significantly higher than the controls. **p < 0.01 (unpaired two-tailed Student's t test). n = 10 control; n = 7 HFD. C′, Terminal FBG in HFD 24 + 36 mice was significantly higher than the controls. *p < 0.05 (unpaired two-tailed Student's t test). n = 8 control; n = 7 HFD. The impact of HFD on food consumption, FBG, body weight, and tactile response in male and female mice is shown in Extended Data Figure 1-2. A′′, ipGTT in HFD 4 + 16 mice was significantly different to controls at all time points. *p < 0.05; **p < 0.01; ***p < 0.001; Bonferroni post hoc test. n = 4 or 5 per group. The overall effect from the HFD diet was extremely significant. p < 0.0001 (two-way ANOVA). B′′, ipGTT in HFD 4 + 36 mice was significantly different from controls at 60 and 120 min. ***p < 0.001 (Bonferroni post hoc test). n = 4-7 per group. The overall effect from the HFD diet was extremely significant. p < 0.0001 (two-way ANOVA). C′′, ipGTT in HFD 24 + 16 mice was significantly different from controls at 30, 60, and 120 min. ***p < 0.001 (Bonferroni post hoc test). n = 10 per group. The overall effect from the HFD diet was extremely significant. p < 0.0001 (two-way ANOVA). D, Plasma cholesterol levels were significantly increased in HFD versus control 4 + 36 mice. ****p < 0.0001 (one-way ANOVA). n = 3 per group. E, Plasma phospholipid levels were significantly increased in HFD versus control 4 + 36 mice. ****p < 0.0001 (one-way ANOVA). n = 3 per group. F, Nonesterified fatty acid (NEFA) levels did not differ in HFD versus control 4 + 36 mice (one-way ANOVA, n = 3 per group). G, Triglyceride levels did not differ in HFD versus control 4 + 36 mice (one-way ANOVA, n = 3 per group). Quantitation of hairy skin and glabrous skin IENFD is shown in Extended Data Figure 1-3.

