Figure 2.
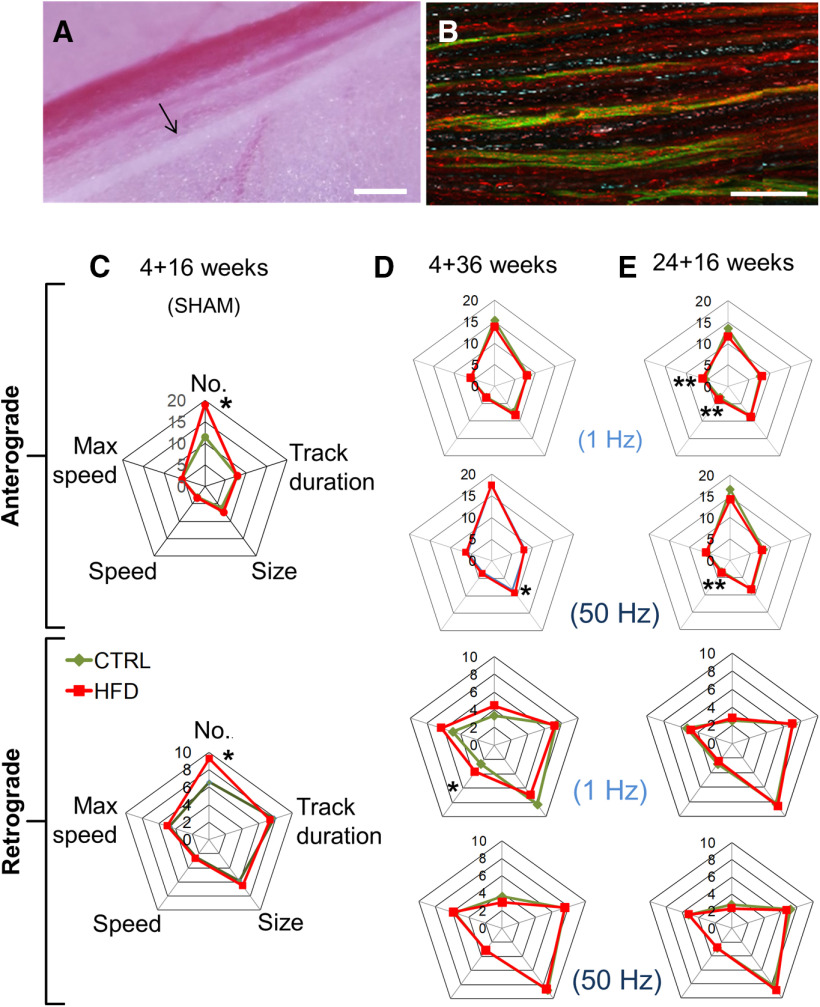
HFD mice do not exhibit impaired mitochondrial transport in saphenous nerve axons in vivo. A, The saphenous nerve (black arrow), blood vessels, and the surrounding connective and fat tissue are exposed in the left thigh after skin incision. Scale bar, 1 cm. B, Time-lapse high-magnification confocal image of saphenous nerve axons in CFP transgenic mouse with CFP+ axonal mitochondria (blue). Isolectin-IB4 (green) labels a proportion of unmyelinated C-fibers and TMRM labels polarized mitochondria. Magenta, pink, or white represents CFP+, TMRM+ mitochondria. Red represents CFP–, TMRM+ mitochondria. Scale bar, 50 µm. C, Spider-web diagram showing characteristics of polarized, motile mitochondria in sham-stimulated saphenous nerve axons of HFD 4 + 16 mice. There were significantly more motile anterograde and retrograde mitochondria in HFD than in control axons. *p < 0.05 (two-way ANOVA). Data are mean of 37-66 axons per group for each category analyzed; n = 2 mice per group. Videos of mitochondrial trafficking in control diet and HFD mice are shown in Movies 1 and 2, respectively. D, E, Spider-web diagrams showing characteristics of polarized, motile mitochondria in stimulated saphenous nerve axons of 4 + 36 (D) or 24 + 16 (E) mice. There were no overall differences in axonal mitochondrial transport. However, HFD 4 + 36 mice exhibited larger anterogradely transported mitochondria in nerves conducting at 50 Hz and higher average retrograde speed at 1 Hz. *p < 0.05 (two-way ANOVA). Data are mean of 77-97 total axons per group; n = 3 mice per group. HFD 24 + 16 mice exhibited larger average speed of anterograde mitochondrial transport at both 1 and 50 Hz and higher anterograde maximum speed of mitochondrial transport at only 1 Hz. **p < 0.01 (two-way ANOVA). Data are mean of 77-97 total axons per group; n = 3 mice per group.

