Figure 5.
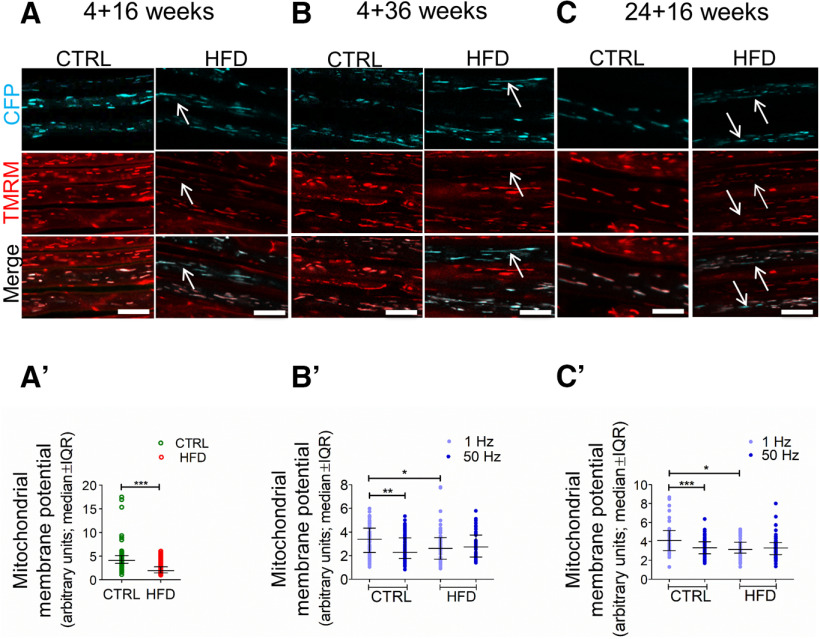
HFD mice exhibit reduced MMP in saphenous nerve axons in vivo. A–C, High-magnification confocal image of saphenous nerve axons in CFP transgenic mouse with CFP+ axonal mitochondria (blue, top) stimulated at 1 Hz. TMRM labels polarized mitochondria (red, middle). Bottom, Merged. Magenta, pink, or white represents CFP+, TMRM+ mitochondria. Red represents CFP–, TMRM+ mitochondria. In control mice, all axonal mitochondria were polarized and were magenta, pink, or white on merged images. Bottom, Red mitochondria are axonal, non-CFP expressing, or nonaxonal. In contrast, in all HFD groups, some axonal mitochondria were depolarized and appear blue on merged images (bottom, white arrows). A′, The ratio of TMRM intensity in CFP+ mitochondria versus the adjacent axoplasm indicates MMP and is significantly lower in HFD 4 + 16 mice versus controls. ***p < 0.001 (unpaired Student's t test). Data are mean ± SEM. n = 4 or 5 mice per group. B′, The ratio of TMRM intensity in CFP+ mitochondria versus the adjacent axoplasm indicates MMP and is significantly lower in HFD 4 + 36 mice versus controls in 1 Hz-stimulated axons. Increasing the stimulation frequency to 50 Hz lowers MMP in control mitochondria but has no effect in HFD mitochondria. *p < 0.05; **p < 0.01; ***p < 0.001; two-way ANOVA. Data are mean ± SEM. n = 4 or 5 mice per group. C′, The ratio of TMRM intensity in CFP+ mitochondria versus the adjacent axoplasm indicates MMP and is significantly lower in HFD 24 + 16 mice versus controls in axons stimulated at 1 Hz. Increasing the stimulation frequency to 50 Hz lowers MMP in control mitochondria but has no effect in HFD mitochondria. *p < 0.05; **p < 0.01; ***p < 0.001; two-way ANOVA. Data are mean ± SEM. n = 4 or 5 mice per group. IQR, Interquartile range.

